
ANALYZING DATA
YOUR FIRST ANALYSIS
CVSuite offers a variety of data about your creative economy covering both the for-profit and nonprofit sectors. After orienting yourself with the tool, using the New to CVS as a guide, you can begin to gather insights about your region. Every analysis starts with a question. Below are a few examples of questions and strategies you can ask yourself as you begin to analyze your data.
WHAT IS HAPPENING IN MY CREATIVE ECONOMY?
Establishing a baseline in your region is a great place to start your creative economy analysis. Your essential creative economy statistics are: 1.) the amount of money generated from creative industries, 2.) the number of jobs within your creative industries, and 3.) the size of your nonprofit sector. The CVI value can be used to compare your economy to the nation or other comparison regions. Evaluating your largest industry and occupation groups can demonstrate the largest contributing sectors to your local region.
METRICS
- Total industry earnings
- Total occupation jobs
- Most recent CVI value
- Trends in CVI for past 5 years
- Total Nonprofit Revenues
These metrics can all be found in the CVSuite Snapshot Report. Instructions on how to locate and understand these metrics can be found in the New to CVSuite page.
WHAT ARE THE DRIVING INDUSTRIES AND OCCUPATIONS IN MY REGION?
Evaluating which industries and occupations are vital to your region will help guide your strategies and future planning. The size of an industry, such as the total earnings generated or the number of supporting jobs, can show you which industries are contributing the most to the economy. You can look at the location quotient, which measures how concentrated a region’s jobs are compared to the national average, to help you determine which industry jobs are more concentrated in your region compared to other regions. The location quotient measures how concentrated a region’s local jobs are compared to the national average. You can find what makes your region unique by identifying industries and occupations with a location quotient greater than one. You can also ensure that there are enough jobs in your region to be contributing a meaningful amount to the economy by only including occupations and industries that have jobs greater than 50. Analyzing the change in location quotient over the past three to five years can help identify growing and declining sectors in your economy.
METRICS
- Industries with LQ greater than 1 and jobs greater than 50
- Occupation with LQ greater than 1 and jobs greater than 50
Location Quotient for industries and occupations can be found in the downloadable reports. Learn how to access them in the New to CVSuite and Reports & Visualizations sections of the guide.
IS MY REGION’S ECONOMY GROWING?
Tracking trends in CVSuite is an important part of measuring your region’s growth trajectory. It’s worth looking at both the three-year and five-year trends to analyze potential long-term and short-term changes. You can then compare this with the current year’s data to examine whether your region’s local economy is on a growth pattern, stagnant, or in decline. Whether the trend is up or down, digging deeper into the data and analyzing which industries and occupations may be contributing to that trend will give you a better understanding of the driving factors that influence your region.
METRICS
- Change in total industry earnings past 5 years
- Change in total occupation jobs past 5 years
- Change in nonprofit revenues past 5 years
- Change in nonprofit establishments past 5 years
- Compare to another comparison region
For more information about how CVSuite displays historical data, refer to the New to CVSuite and Reports & Visualizations guides.
IS THE CREATIVE WORKFORCE DIVERSE?
Research shows that diversity in the workforce brings new perspectives and values that drive innovation and creativity. With CVSuite, you can examine the differences and gaps in diversity from the population and workforce demographics. Comparing your demographics to the nation can reveal interesting facts about your community that distinguish it from other places.
METRICS
- Region population demographics on race/ethnicity, gender, and age
- Breakdown of industry jobs by demographics on race/ethnicity, gender, and age
- Breakdown of occupation jobs demographics on race/ethnicity, gender, and age
For a more in-depth instruction on how to access demographic insights about your creative economy, watch our videos: Dive Into Demographic Data with CVSuite and Diversity in the Creative Sector Webinar.
HOW MUCH DOES THE GIG ECONOMY CONTRIBUTE TO THE REGION?
The gig economy refers to an international trend where people, including artists and creatives, can work remotely, partake in entrepreneurship opportunities and projects, and explore interests in multiple sectors, providing them with multiple sources of income. Through the classes of workers settings, you can examine how much self-employed and extended proprietors contribute to your local economy. Depending on the current trends and outcomes, you can consider how your organization supports this emerging workforce.
- Total industry jobs
- Total industry jobs (self-employed)
- Total industry jobs (extended proprietor)
- Total occupation jobs
- Total occupation jobs (self-employed)
- Total occupation jobs (extended proprietor)
For more information about how gig workers and the creative economy interact, visit Counting the Self-Employed in your Creative Economy. To learn more about the types of workers available in the tool, visit the CVSuite Data Guide.
A DEEPER DIVE
This section will guide you step-by-step through the process of digging deeper into the data, using an example region with real data. Following these general guidelines should help hone and build your data analytics intuition.
STEP 1: UTILIZE VISUALS TO IDENTIFY CHANGES OR PATTERNS IN YOUR DATA
Looking for trends in your data is a great place to start any analysis. A trend is any pattern in the data. Because trends are not always easily noticed when looking in tables or spreadsheets, CVSuite has created multiple data visuals to help identify these patterns. In this example, we start by looking at the CVI.
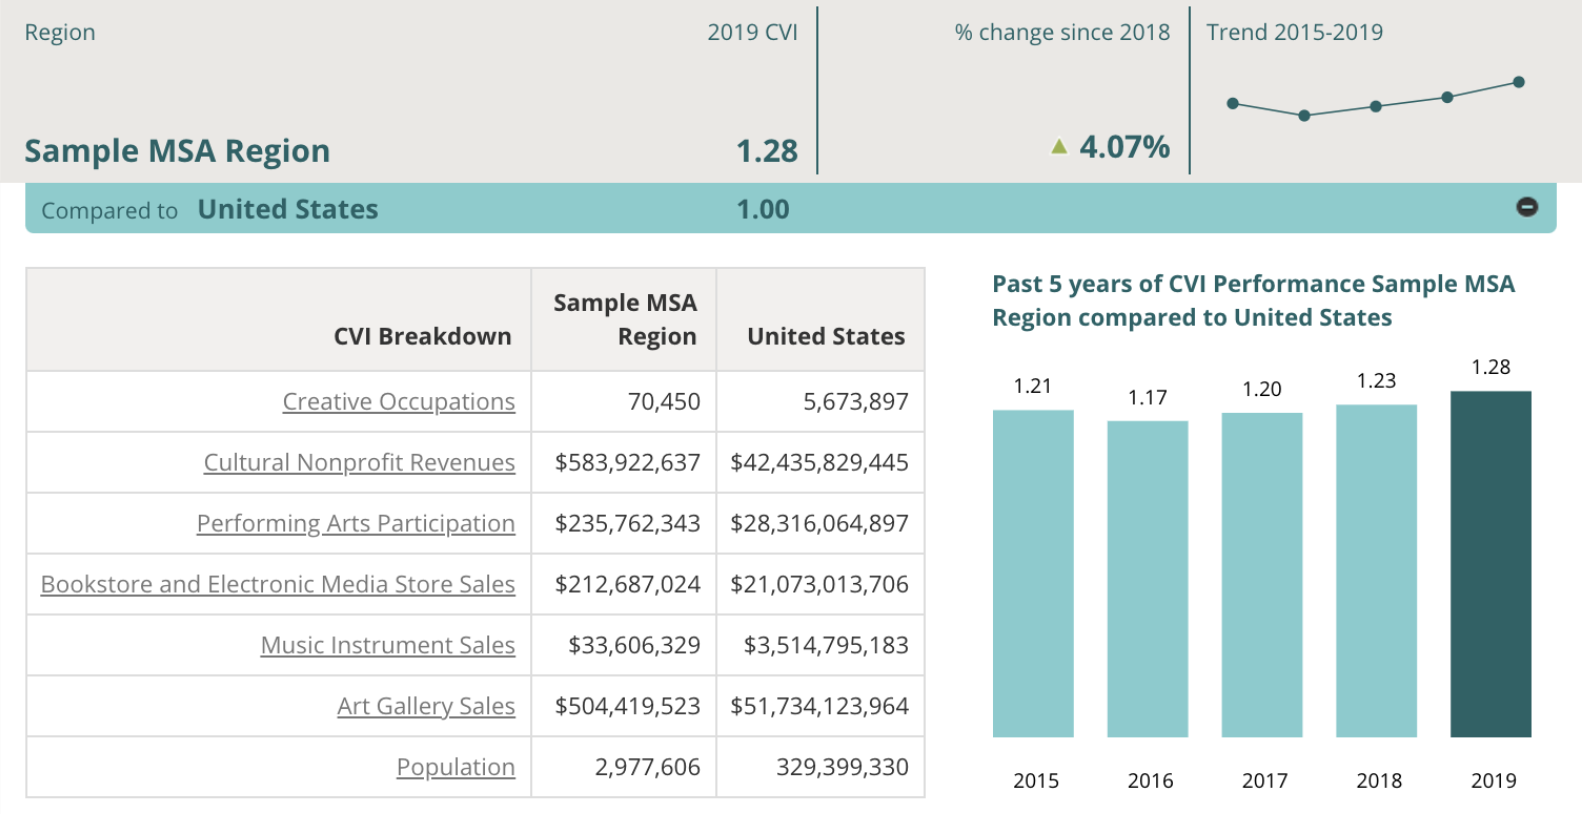
In the past five years, we can see the CVI only decreased once, from 2015-2016, and from 2017 to 2019 there has been a continual increase. This change provides insight into the health of the region’s creative economy and indicates that further analysis should be considered. For this analysis, however, we will strictly focus on the upward trend from 2016 to 2019. What is the driving force behind the increase in the region’s creative vitality?
STEP 2: NARROW DOWN WHAT IS CAUSING CHANGES
Changes in the creative economy will typically, but not always, manifest in changes to multiple factors at the same time. The Creative Vitality Index is built to help identify those changes. By downloading the CVI spreadsheets for both 2016 and 2019, you can compare each variable. The table below was built from the CVI spreadsheets and calculates the per person values for each CVI factor.
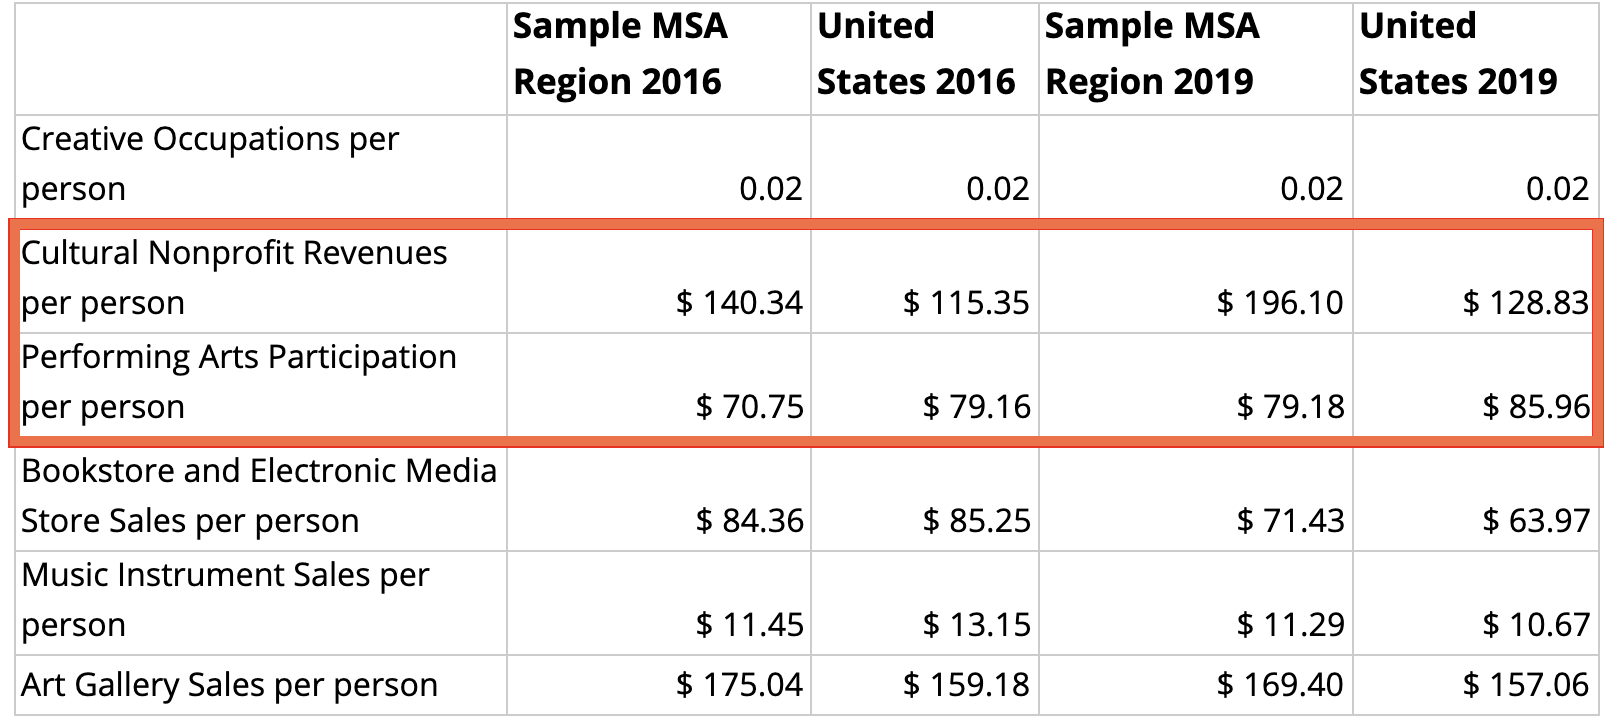
The values above were calculated to determine what proportion of the region’s population is part of the creative workforce, how much the region generates in creative industries’ sales per person, and how much art and culture nonprofit revenue the region generates per person. They were calculated by dividing each of the occupation totals, industry sales, and nonprofit values by the total population.
Since we know the CVI has increased, it is useful to identify what creative economy factors have increased the most. In this example, cultural/art nonprofit revenues and performing arts participation increased the most in comparison to the U.S. See below:
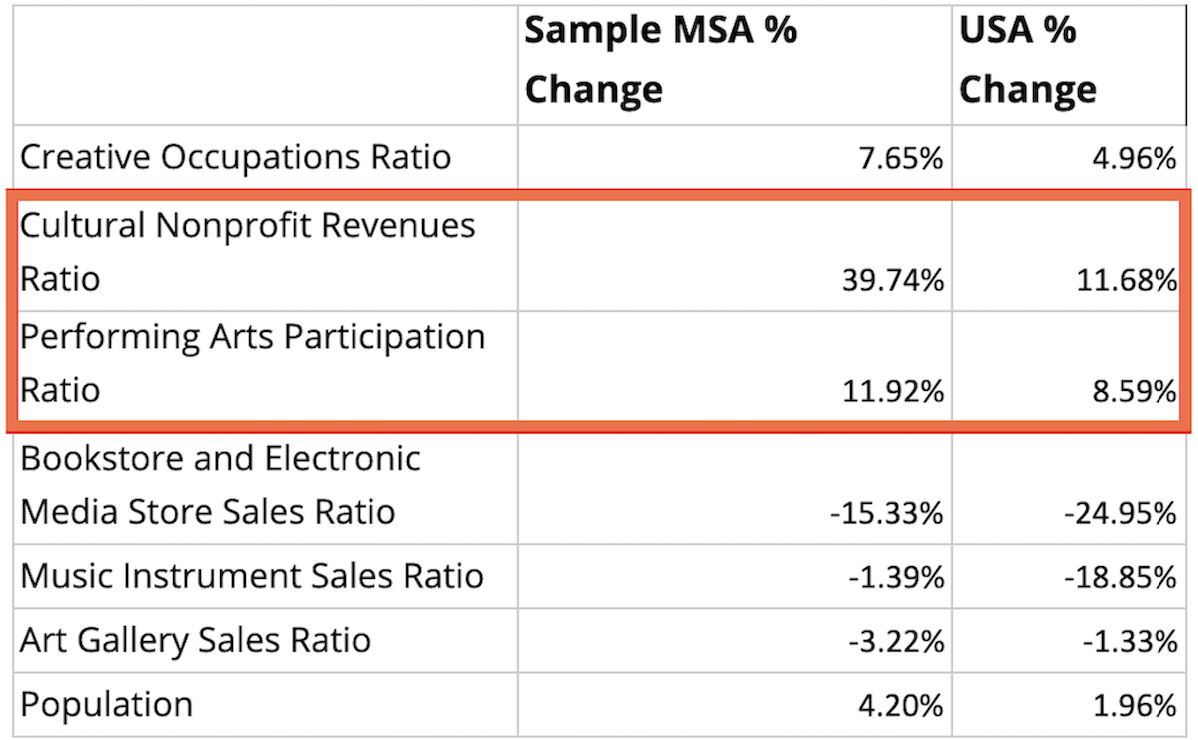
(NOTE: Other factors played a role in the CVI for the sample region increasing, such as bookstore, electronic store, and music instrument sales decreasing less than the U.S. This is another consideration to explore.)
After identifying the major contributors to the region’s growing creative economy as nonprofit revenues and performing arts, the next step would be to narrow down what type of performing arts and nonprofits are the most productive.
STEP 3: CONFIRM HIGH PERFORMING CREATIVE INDUSTRIES AND OCCUPATIONS
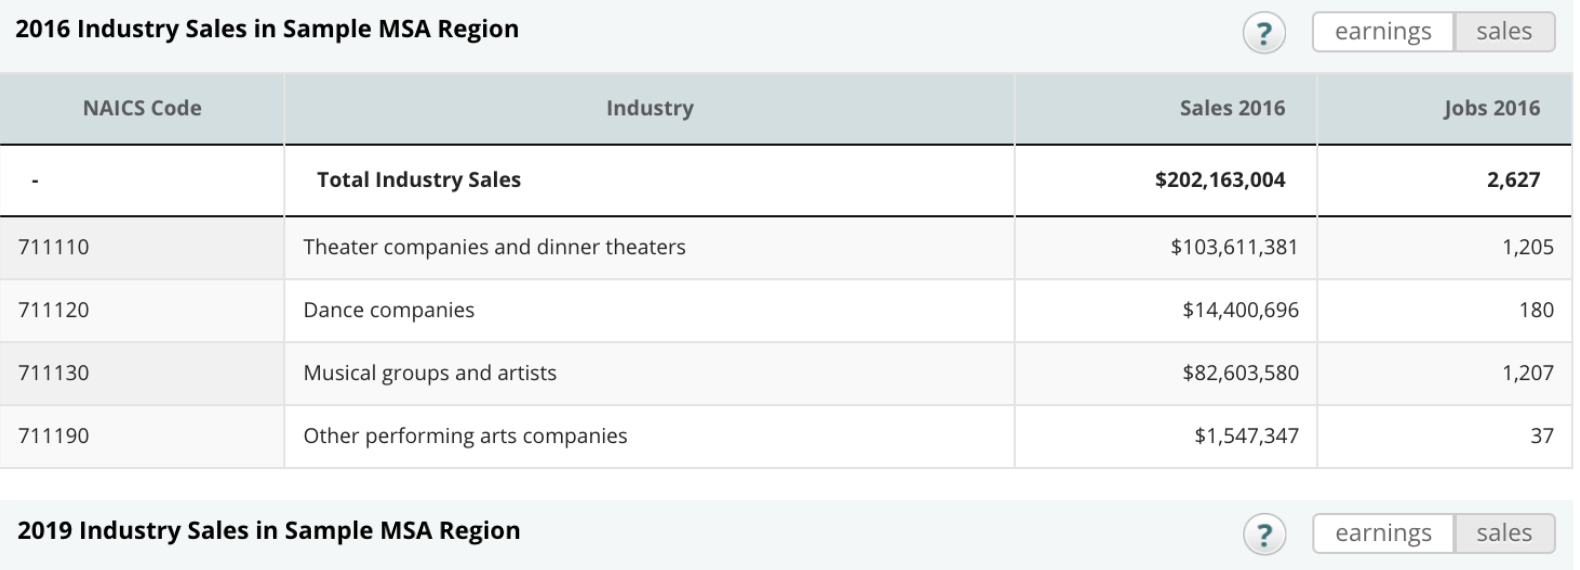
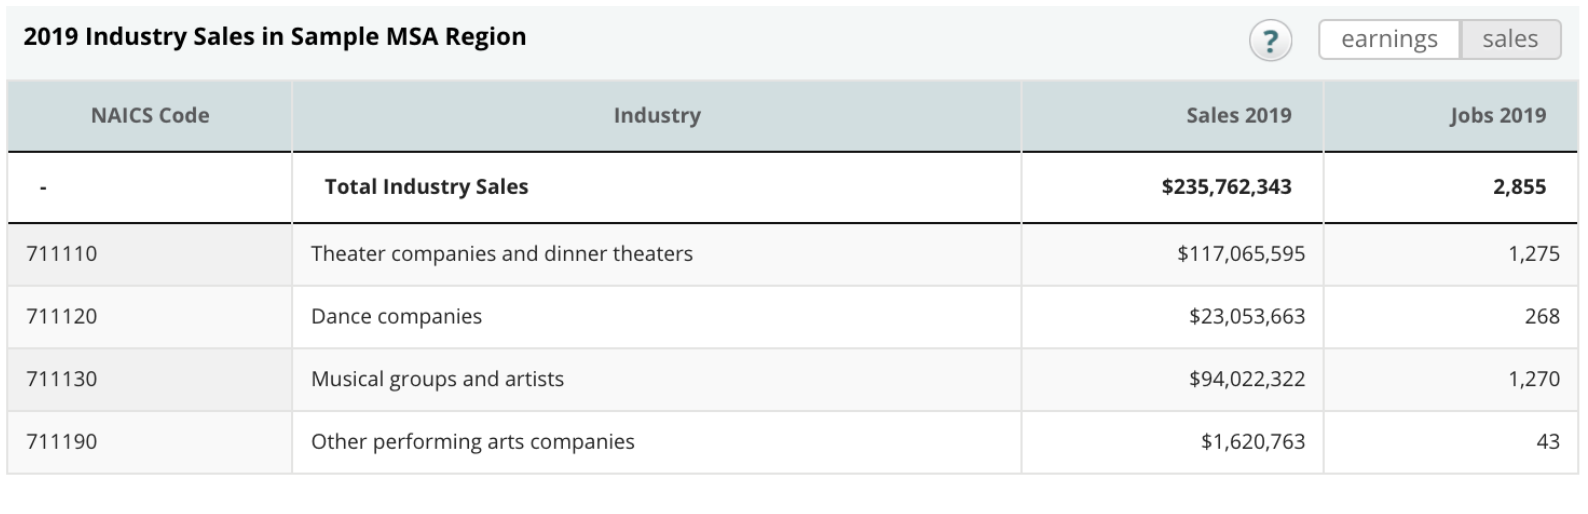
Based on the initial analysis, we can conclude that the performing arts have helped increase the region’s creative vitality when compared to the United States. The CVI performing arts category is actually an aggregate of four industries centered around the performing arts. So we have to ask, which of the four performing arts industries increased their sales the most between 2016 and 2019?
To do this, we will want to go to the Industry section in the tool. Here we can sort the table to display the industries with the highest sales at the top. It turns out that theater companies and dinner theaters increased sales by 13% between 2016 and 2019, accounting for over $13 million.
When you compare all traditionally defined creative occupations* within CVSuite, the top three with the most growth between 2016 and 2019 are choreographers, lighting technicians and media and communications equipment workers, and art directors.
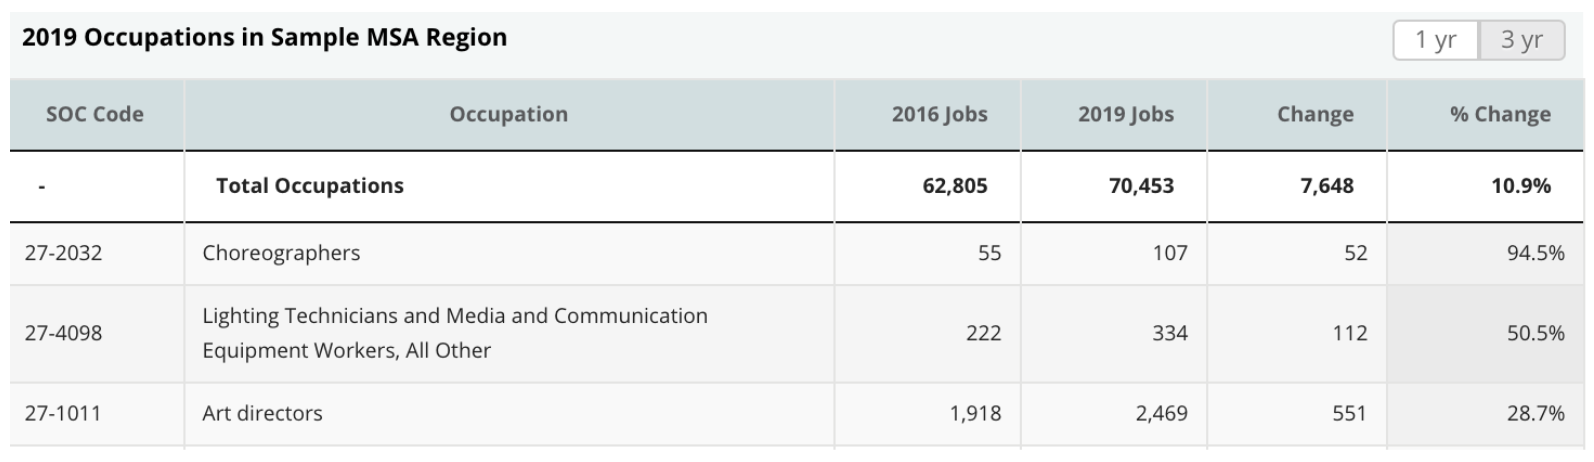
These three creative occupations accounted for 715 new jobs to the region in the last three years. These occupations would also confirm that theaters and dance companies industries grew during this period.
STEP 4: CONFIRM NONPROFIT CONTRIBUTIONS
Arts and cultural nonprofits grew 28% faster than the national average in this sample region between 2016 and 2019. Using the CVSuite Data Charts it is easy to identify the top performing arts and cultural nonprofits by program revenues.
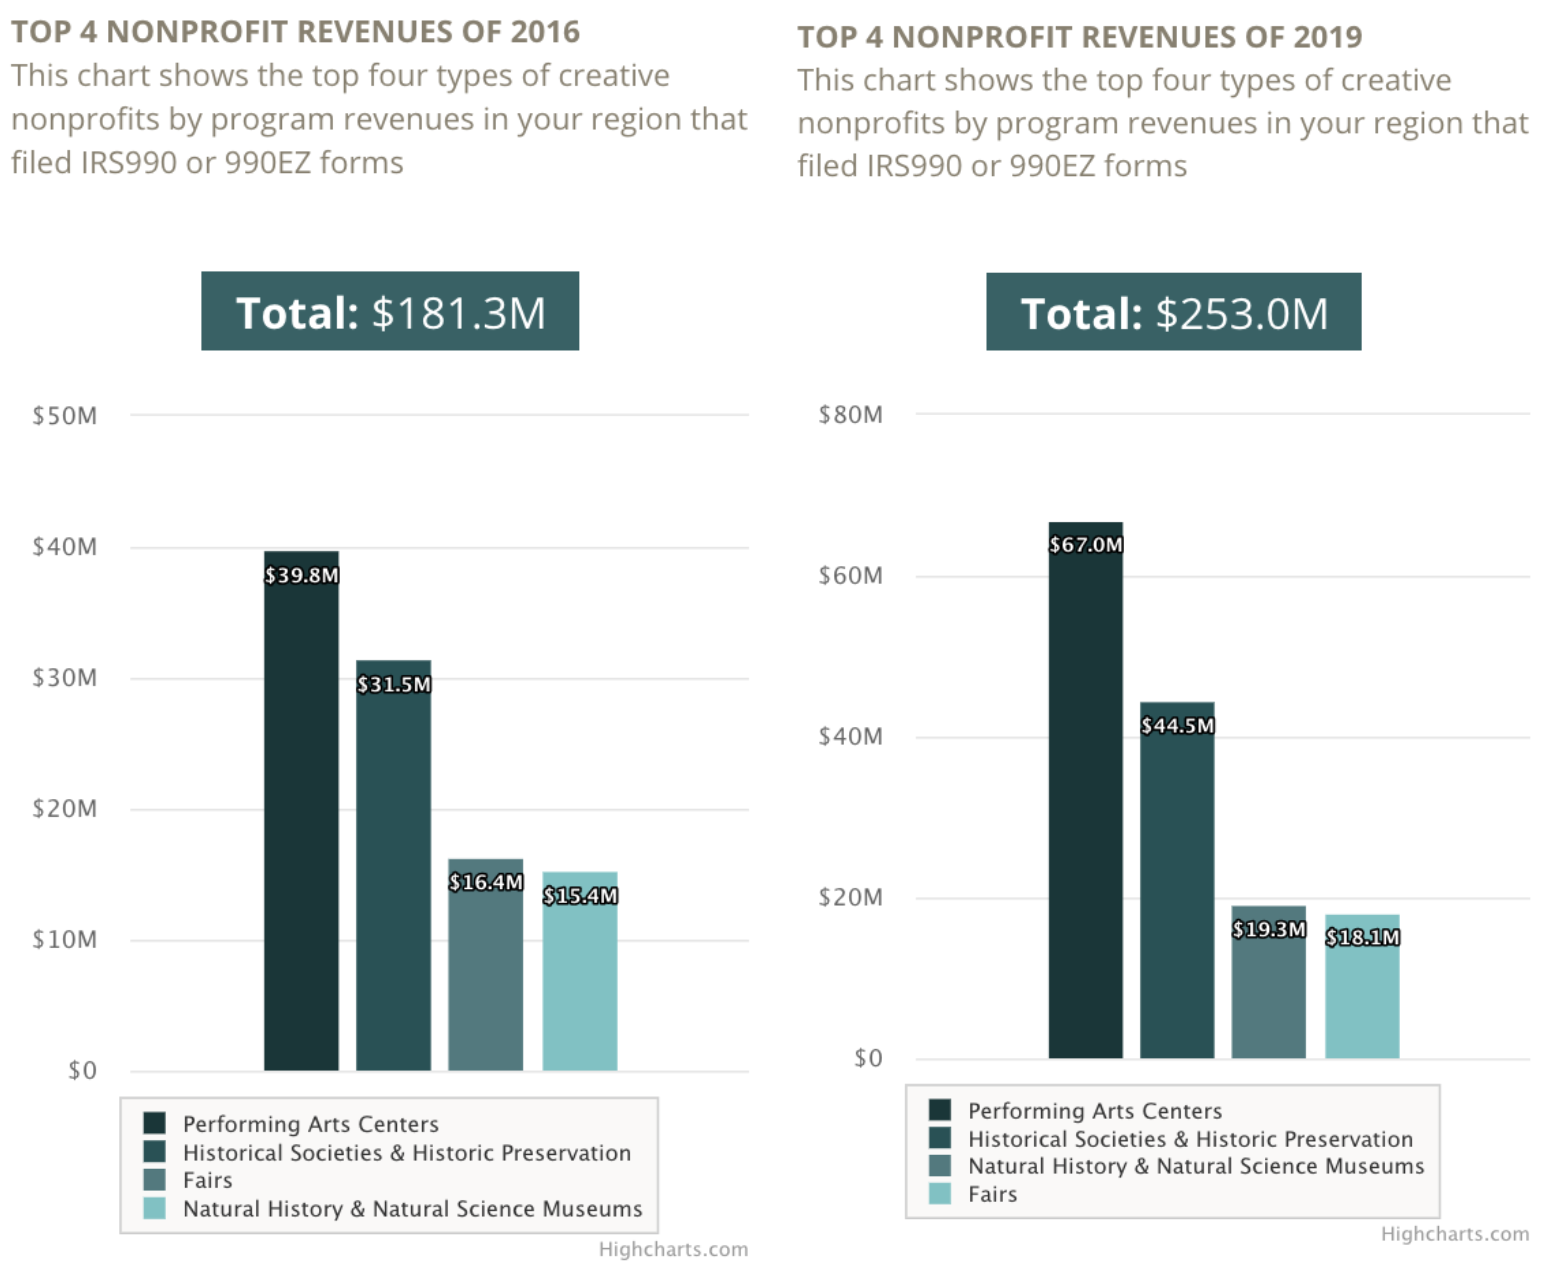
In this example, performing arts centers grew by over $27 million, between 2016 and 2019.
STEP 5: CONCLUSIONS AND NEXT STEPS
So why have the performing arts grown so much in the last three years? If we were to do research, we might find that the community donated more than $22 million to increase the performing arts between 2017 and 2018. From this quick analysis, it is clear that the community’s investment in the performing arts paid off by generating more than $60 million in nonprofit revenues, employing over 2,800 industry workers, and contributing more than $230 million in regional sales.
This analysis is only the beginning of uncovering the full impact of this region’s creative economy, though it gives some insight into the analysis process. For more information or assistance with your project, reach out to the CVSuite team at cvsuiteteam@westaf.org.
*Primary Industries offered in the CVSuite were selected based on relevance to the creative economy and the economic contributions that these industries offer to the creative economy. Input from CVSuite clients played an important role when selecting the industries for inclusion in the CVSuite. The primary occupations offered in the CVSuite were selected based on two criteria: Occupations that are highly correlated with measured skill sets in thinking creatively, originality, and fine arts knowledge as measured by the Employment and Training Administration’s “O*NET” occupational network database.
MORE DATA ANALYSIS RESOURCES

CVSuite Data Dives: The Key Differences Between Industry Sales and Earnings Data
This blog will dive deeper into the differences between the data and the type of analyses that can be done with industry sales and earning data.

CVSuite Data Dives: The Creative Vitality Index Explained
This blog will dive deeper into ways to use the Creative Vitality™ Index (CVI™) to compare a region to the national average or another region.

CVSuite Data Dives: Diversity and Your Creative Sector
This blog will dive deeper into the newly available race and ethnicity data in the CVSuite tool. We explain how you can use the data to compare the diversity present in the creative economy in your region with that of other regions in the country or the country as a whole.

This blog will explain the initial steps you should take when identifying and selecting your peer regions for comparisons, benchmarking, and measuring the growth of your region.