

Selecting peer regions to which to compare your region’s creative economic growth can be a daunting task. The first step to identifying a peer region is to determine what your region’s economic and creative industry goals are and then look for a place that has a similar outlook. Other factors to take into consideration include the population size, the growth of the workforce, location to nearby regions, and whether it has similar creative sectors. The state arts agency or local economic development office also may have a list of peer regions that could be useful for your region.
Peer City Identification Tool (PCIT)
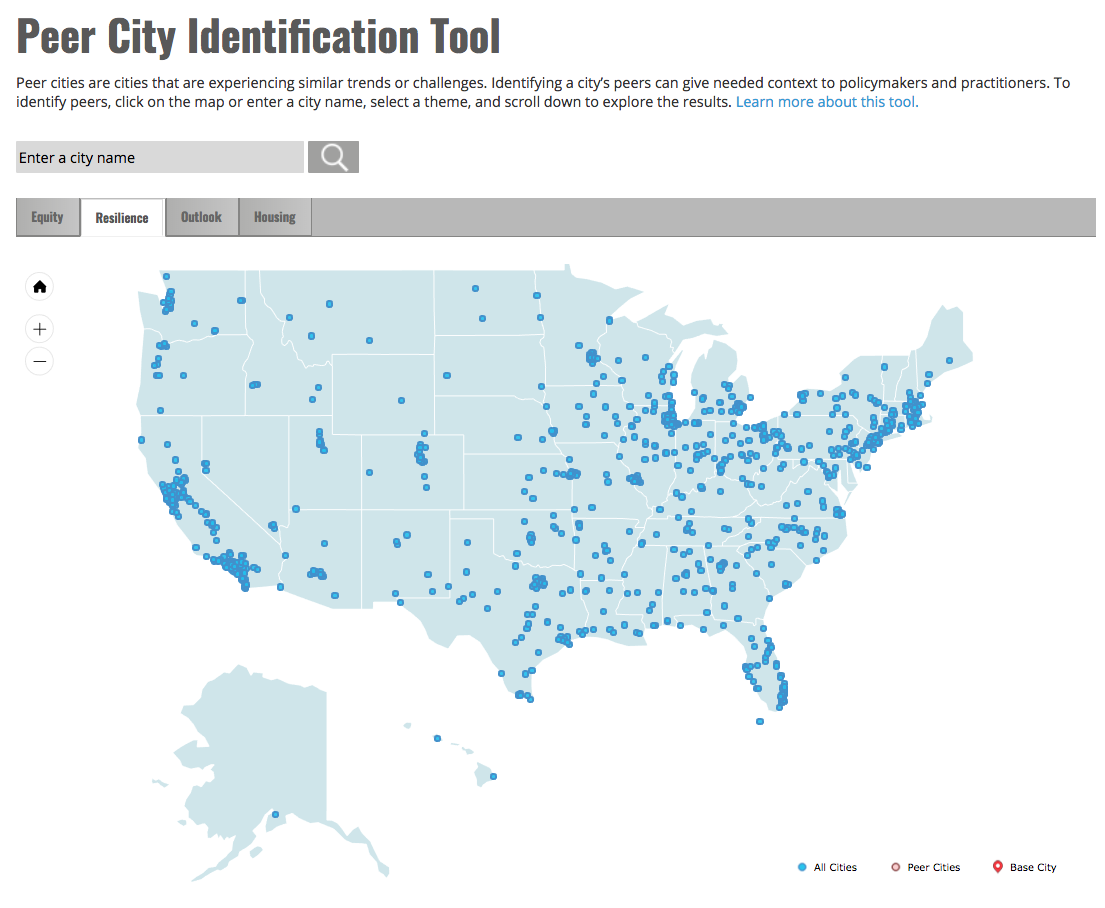
There are tools available to help you find comparison regions. In 2017, the Federal Reserve Bank of Chicago developed the Peer City Identification Tool (PCIT) to help aspiring cities identify potential peers based on four key themes. The tool uses a collection of economic, demographic, social, and housing indicators to identify clusters of cities with similar traits.
Data in Peer City Identification Tool
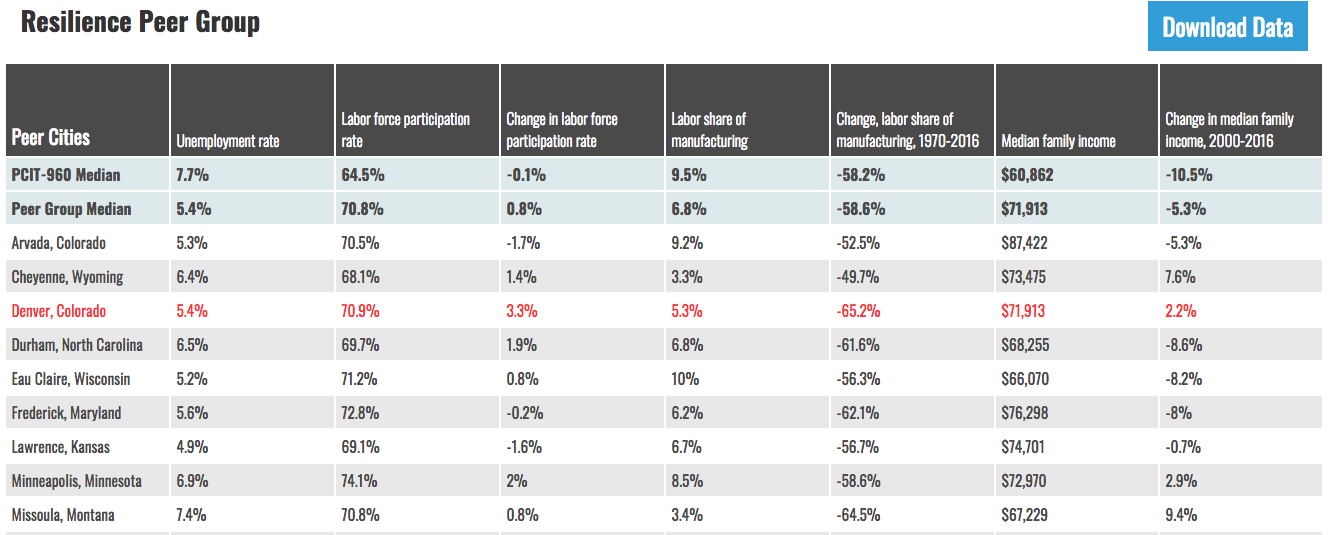
You can select one of the four themed tabs to explore similar cities. The Equity tab identifies cities based on inclusion, access, and diversity. Resilience addresses economic diversification by considering conditions and trends in manufacturing employment, labor force participation, and unemployment. The Outlook theme explores cities that are considered similar based on factors such as immigration, family composition, age structure, and changes in population. Housing addresses the regional real estate trends with metrics on home ownership, renting, competitiveness of housing stock, and housing vacancies. Cities can look to peer cities experiencing similar shifts in these broad categories and then identify common creative economy factors such as creative occupations and earnings growth.

Although creative industries and jobs are not the focus of the PCIT, broader economic factors such as unemployment and housing can be other factors you may want to consider when determining peer cities. Rising employment and higher wages will benefit consumer spending at art galleries, entertainment, and performing arts venues.
An improving housing market can boost architecture and interior design industries. Whether you are just starting to measure your creative economy or have already identified comparison cities, the PCIT may identify new comparison cities for you. Enter your city into the Peer City Identification Tool and start exploring!
Creative Metrics for Comparison
After finding peer regions, you can use the Creative Vitality Suite to further your comparison analysis. The Suite offers 98 industry codes and 85 occupation codes to explore broad creative economy or specific industry clusters. With the data, you can compare employment wages to see if your region’s compensation is competitive with that of its peers. Comparing demographic distribution or earnings growth can help you measure whether your region is growing at the same rate as its peers.
The Creative Vitality Index is another metric in the CVSuite that can be used to investigate if your peer regions have similar for-profit and nonprofit creative activity. It is a per-capita benchmarking measurement used to compare the creative activity taking place within two regions. With the CVSuite, you can compare trends with other regions and identify which creative indicators are most important to their growth and success.
Selecting peer regions and performing comparisons are a useful analysis method for benchmarking and measuring the growth of your region. Let us know how you select your peer regions and what measurements you use to compare your region to others. For more information about the PCIT tool and methodologies click here. Visit the Creative Vitality Suite for creative economic data in your region.
Comments are closed.