REPORTS & VISUALIZATIONS
There are multiple ways within the CVSuite tool to interact with your data. The CVSuite team has resources to help break down your data analysis and distribute the data in the most accessible way.
Downloadable Spreadsheets
The downloadable spreadsheets in CVSuite provide you with raw data for occupations, industry, demographics and nonprofits. The spreadsheets are best used for a deeper analysis into your creative economy than the tool’s overview points provide. Visit New to CVSuite for steps to download the raw data.
OCCUPATION SPREADSHEET
The occupation spreadsheet consists of data related to each occupation you have selected. Visit the Customize Your Data section in the New to CVSuite guide for more information. The following data will be show for each occupation:
- Previous data year’s number of jobs: The previous year’s jobs totals are helpful for establishing a baseline for determining the performance of the current year’s number of jobs.
- Current data year’s number of jobs: The current year’s jobs totals represent the number of jobs per occupation for the selected data year.
- Change: The difference in jobs from previous year to selected year. This metric is good for determining the economic impact of the change in number of jobs.
- % Change: The percentage change in number of jobs from previous year to selected year. This is best used to determine how an occupation is performing against itself. Change in the total number of jobs is better for comparing against the whole creative economy.
- Median hourly earnings: The median hourly earning per job in that occupation. Median hourly earnings is best used when you want to know what a worker’s earnings are, while accounting for outliers who may make a lot more or less than the average worker.
- Average hourly earnings: The average hourly earnings per job in that occupation. Average hourly earnings is a good measure of what a worker earns in wages if you want to include ALL wages, including outliers.
- National LQ: The national location quotient of the occupation is a ratio used to compare the concentration of occupations in a region to that of the United States as a whole. It can be used to determine a region’s occupation or industry specialization, important occupations, and more. Read Using Location Quotient to Measure Creative Economy for more information.
The Occupation Spreadsheet also includes demographic information about each occupation for State, MSA, and County levels. Jump to Demographics to learn more.
INDUSTRY SPREADSHEET
The industry spreadsheet consists of data related to each industry you have selected. Visit the Customize Your Data section in the New to CVSuite guide to learn more. The following data will be show for each industry:
- Current Year’s Sales: Sales is the amount of money that companies in a given industry receive during the year, minus discounts and deductions for returned merchandise. Sales are best used when wanting to know how much money is being processed through the region’s economy.
- Current data year’s number of jobs: Current year’s jobs totals are the number of jobs within each industry. This is a good measure of total workers, including those who may be supplementary. Example: A custodian working at a museum might be counted as a museum worker.
- Earnings per job: The total industry earnings per job. This is best used to estimate how much each job within an industry will be recirculating within the regional economy.
- % Change of Earnings per Job: This is the percentage difference between the previous year’s earnings and the current showing wages trends within an industry.
- Total Earnings: The industry earnings data measure the labor compensation paid to all of the workers in a given industry. Total earnings determine how much an industry is generating for the local economy.
- National LQ: The location quotient for the given industry. Similarly to the occupation LQ it is a ratio used to compare the concentration of industries in a region to that of the United States as a whole. It can be used to determine a region’s industry specialization, important industries, and more. Read Using Location Quotient to Measure Creative Economy for more information.
The Industry Spreadsheet also includes demographic information about each industry for State, MSA, and County levels. Jump to Demographics to learn more.
DEMOGRAPHICS SPREADSHEET
The demographics downloadable spreadsheet consists of data related to each occupation, industry, and region that you have selected. Visit the Customize Your Data section in the New to CVSuite guide to learn more. *Data shown for each region, occupation, and industry will include:
- Selected Year’s Total Number of People/Workers by Ethnicity: The total number of people within each occupation, industry, or region represented by Race/Ethnicity: White, Black or African American, American Indian or Alaskan Native, Asian, Hawaiian or other Pacific Islander, Hispanic or Latino, and Two or More Races. This data can help find the ethnic/racial representation within regions, occupations, or industries and determine if there are any equity discrepancies.
- Selected Year’s Total Number of People/Workers by Gender: The total number of people within each occupation, industry, or region represented by male or female genders. This data can be used to determine discrepancies between male versus female dominated occupations or industries.
- Selected Year’s Total Number of People/Workers by Age: The total number of people within each occupation, industry, or region represented by age groups: 0-24, 25-34, 35-44, 45-54, 55-64, and 65-99 years old. This data can be used to determine industries or occupations that might have a large proportion of them retiring soon or that may be geared to attract a new workforce.
*Demographic data for the ZIP Code level does not include occupation or industry information.
NONPROFIT SPREADSHEET
The nonprofit spreadsheet consists of data related to arts and culture nonprofits within your selected region. Visit the CVS Data guide to learn more about what nonprofit types are included in CVSuite. Data shown for nonprofits by geography will include:
- Program Revenues: The total program service revenue (exempt function income) for all arts and culture nonprofits within the region. Program services are primarily those that form the basis of an organization’s exemption from tax. This information is helpful for determining what a nonprofit or region generated through the distribution of goods and services.
- Contributions and Gifts: The total monetary value of contributions and gifts provided to the nonprofit organization reported on line 1 of the 990 form. This data can be used to determine how much value was generated through fundraising, grants and other activities not captured by the organization’s direct program.
- Investment Income: Interest on savings and temporary cash investments, including gross rental income, interest on securities, etc.
- Special Events: The gross income from all fundraising events and activities, such as galas, dances, carnivals, concerts, sports events, auctions, and door-to-door sales of merchandise. They don’t include events or activities that substantially further the organization’s exempt purpose even if they also raise funds. These would include sales or gifts of goods or services of only nominal value, raffles or lotteries in which prizes have only nominal value, and solicitation campaigns that generate only contributions.
- Total Revenues: The total revenue of each nonprofit organization. This data can help see the total monetary impact that arts and culture nonprofit organizations have on a region.
Data shown for nonprofits by type will include:
- Number of Organizations: This is the total number of nonprofit organizations by type within the selected region. This data can help show saturation of organizations within a region.
- % of Share: This is the percentage of program revenues each type of nonprofit organization generates in comparison to all arts and culture nonprofits within the selected region. This data can be used to determine most efficient types of organizations.
- Program Revenues: The total program service revenue (exempt function income) by nonprofit type. Program services are primarily those that form the basis of an organization’s exemption from tax. This information determines what a nonprofit or region generated through the distribution of goods and services.
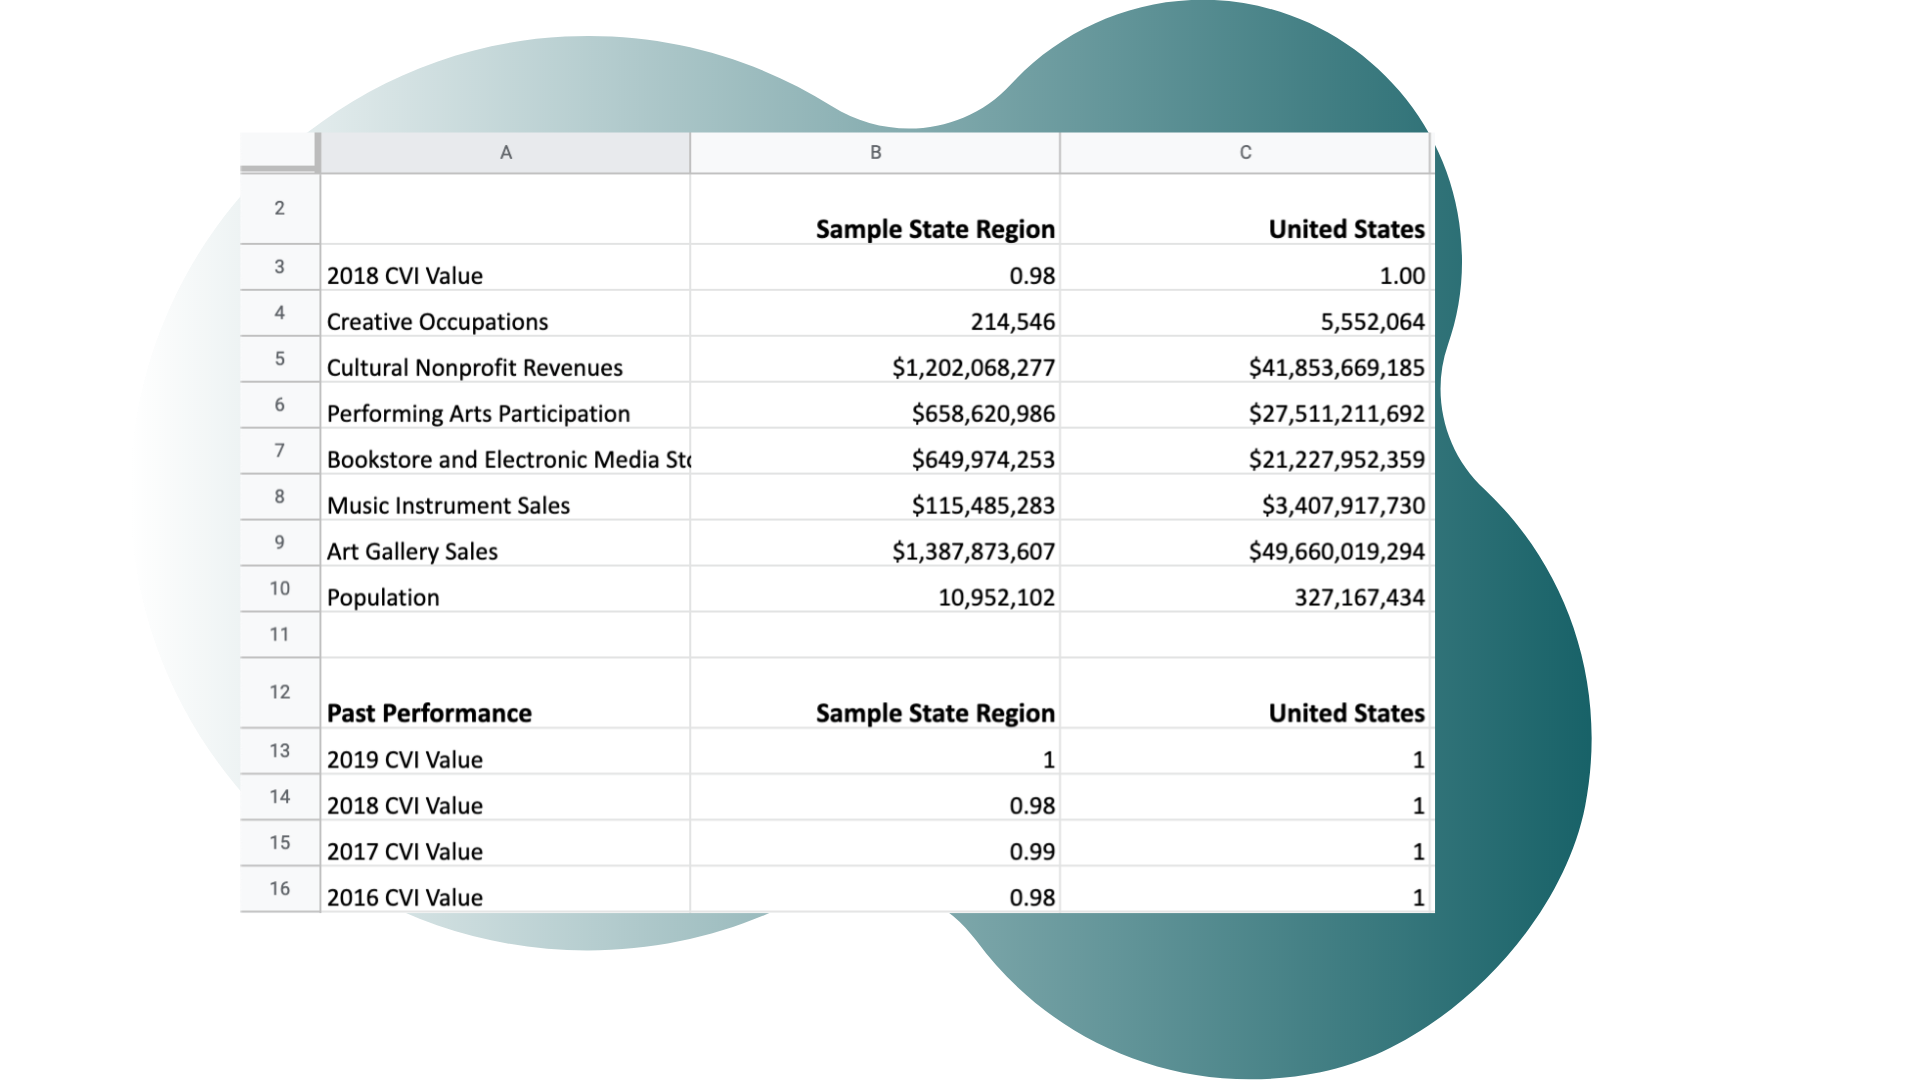
CVI Download
The CVI Creative Vitality Index (CVI) download contains all of the data used to build the CVI for the selected year and the CVI values for the previous five years. For more information about how these numbers are generated, visit the Creative Vitality Index page.
The Snapshot Report
In addition to the raw data downloadable spreadsheets, CVSuite’s Snapshot Report automatically compiles and visualizes the user’s creative economy metrics. Once you define your creative economy with the data settings and choose a year of analysis, the Snapshot Report will display the high-level descriptive statistics around the creative occupations, creative industries, and art/culture nonprofits. The Snapshot Report is located on the Reports page of the tool.
Click on the orange plus sign to see more details about the Snapshot Report.
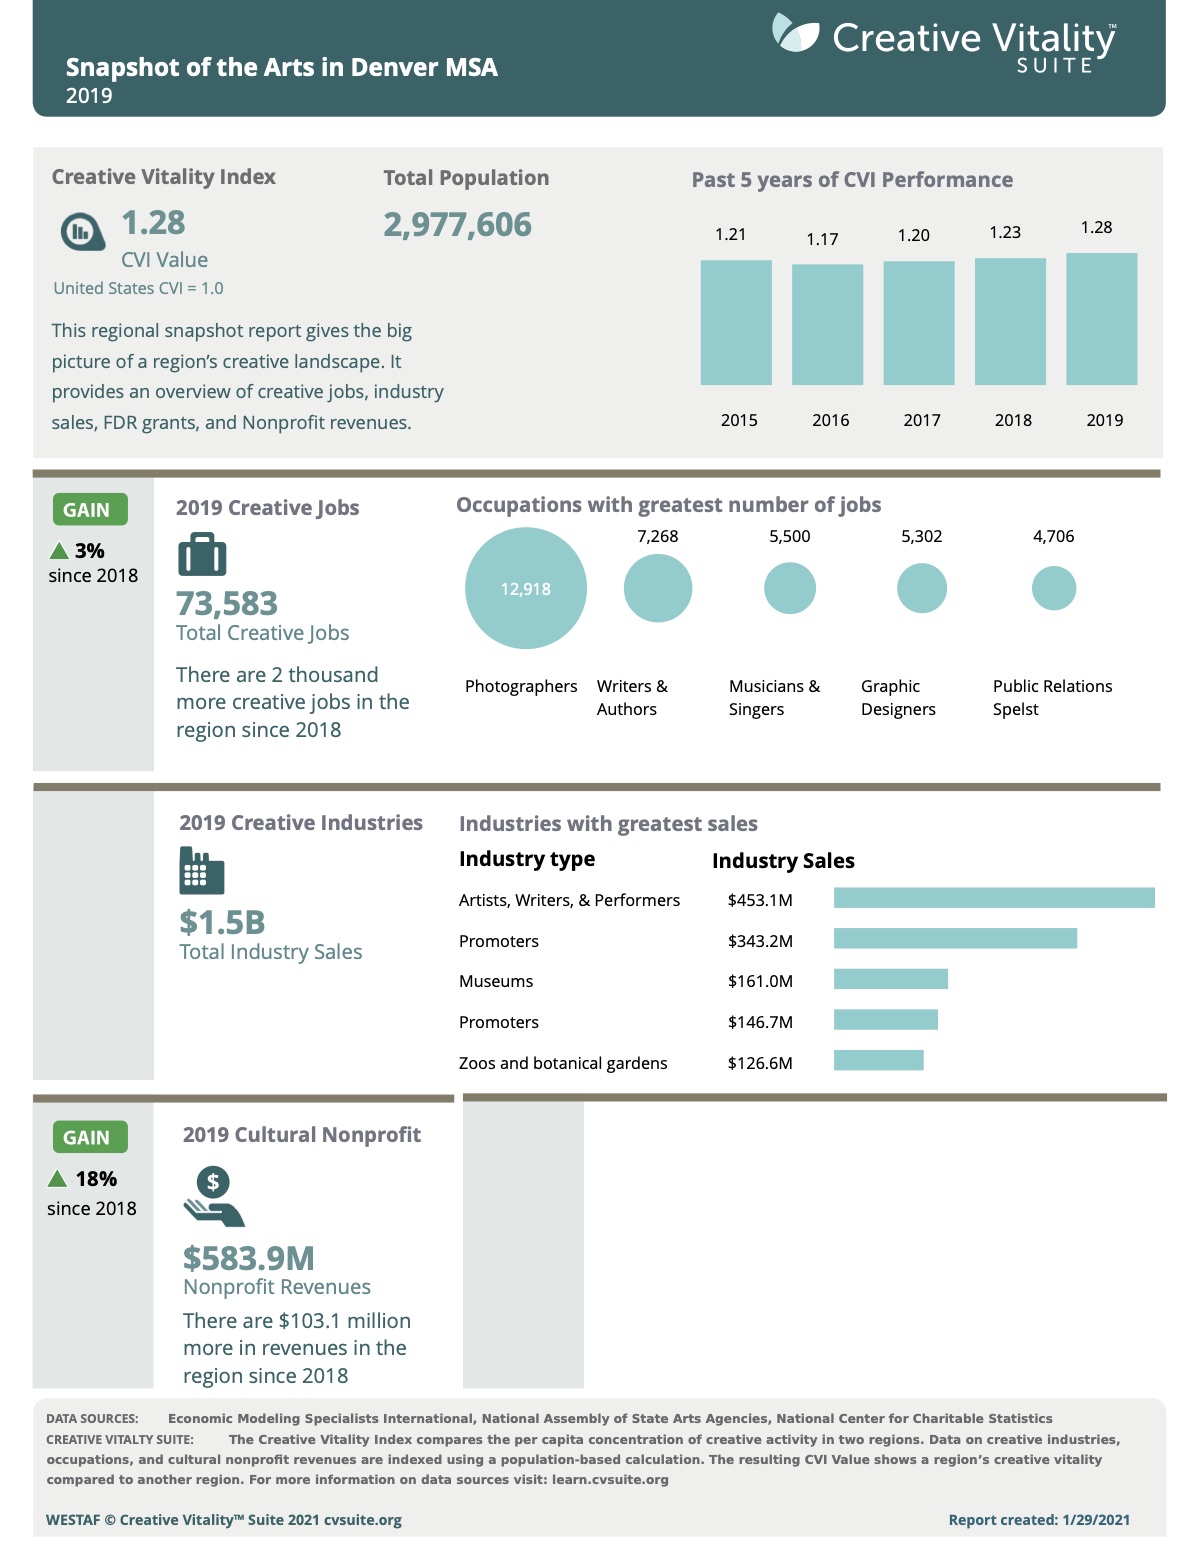
SECTION 1: CVI VALUE
This section displays your region’s current CVI value and the past five years of CVI performance. The CVI is a per capita measurement of your region’s concentration of creative economy in comparison to the United States. Similar to a location quotient, a CVI greater than one indicates a concentration of creative activity that is greater than the comparison region.
SECTION 2: CREATIVE OCCUPATIONS
This section displays the number of creative occupation jobs in your region’s workforce with annual percent change from the previous year. The top five occupation groups provide some insight into the size of your region’s biggest job contributors.
SECTION 3: CREATIVE INDUSTRIES
This section displays the total creative industry earnings distributed in your region with annual percent changes from the previous year. The top five industry groups provide some insight into the largest industries pumping money back into the local economy. You can also choose to display industry sales instead of earnings.
SECTION 4: NONPROFIT REVENUES
This section displays the total nonprofit arts revenue being generated locally by the nonprofit sector. Most arts agencies are directly supporting artists as well as local nonprofits. Growth and sustainability in nonprofit revenues can be an indicator of successful efforts to support this sector through programming and other economic initiatives.
SECTION 5: DATA SOURCES
The last page of the Snapshot Report displays the sources of the data and the code selections used. The data provided on the report are provided by the Creative Vitality Suite, Emsi, and the Internal Revenue Service. This page is provided for transparency and purposes of data verification and reproduction.
HOW TO USE THIS REPORT
The Snapshot Report is most effective when the insights are paired with local stories from the community. Your agency can summarize programming and initiatives that may have contributed to local industry and occupation sectors. For example, explaining which creative industries would have seen benefits from your organization’s operational grants would validate the trends seen in the industry data. Another example would be to talk about the number of creative jobs within the region and the number of artists supported by projects grants. With supplemented stories, the Snapshot Report can demonstrate your organization’s impact in the creative economy.
Data Charts
The Data Charts visualize the creative economy data to allow you to easily analyze, interpret, and share your analysis. The visualizations can be downloaded by visiting Data Charts within the Data Section.
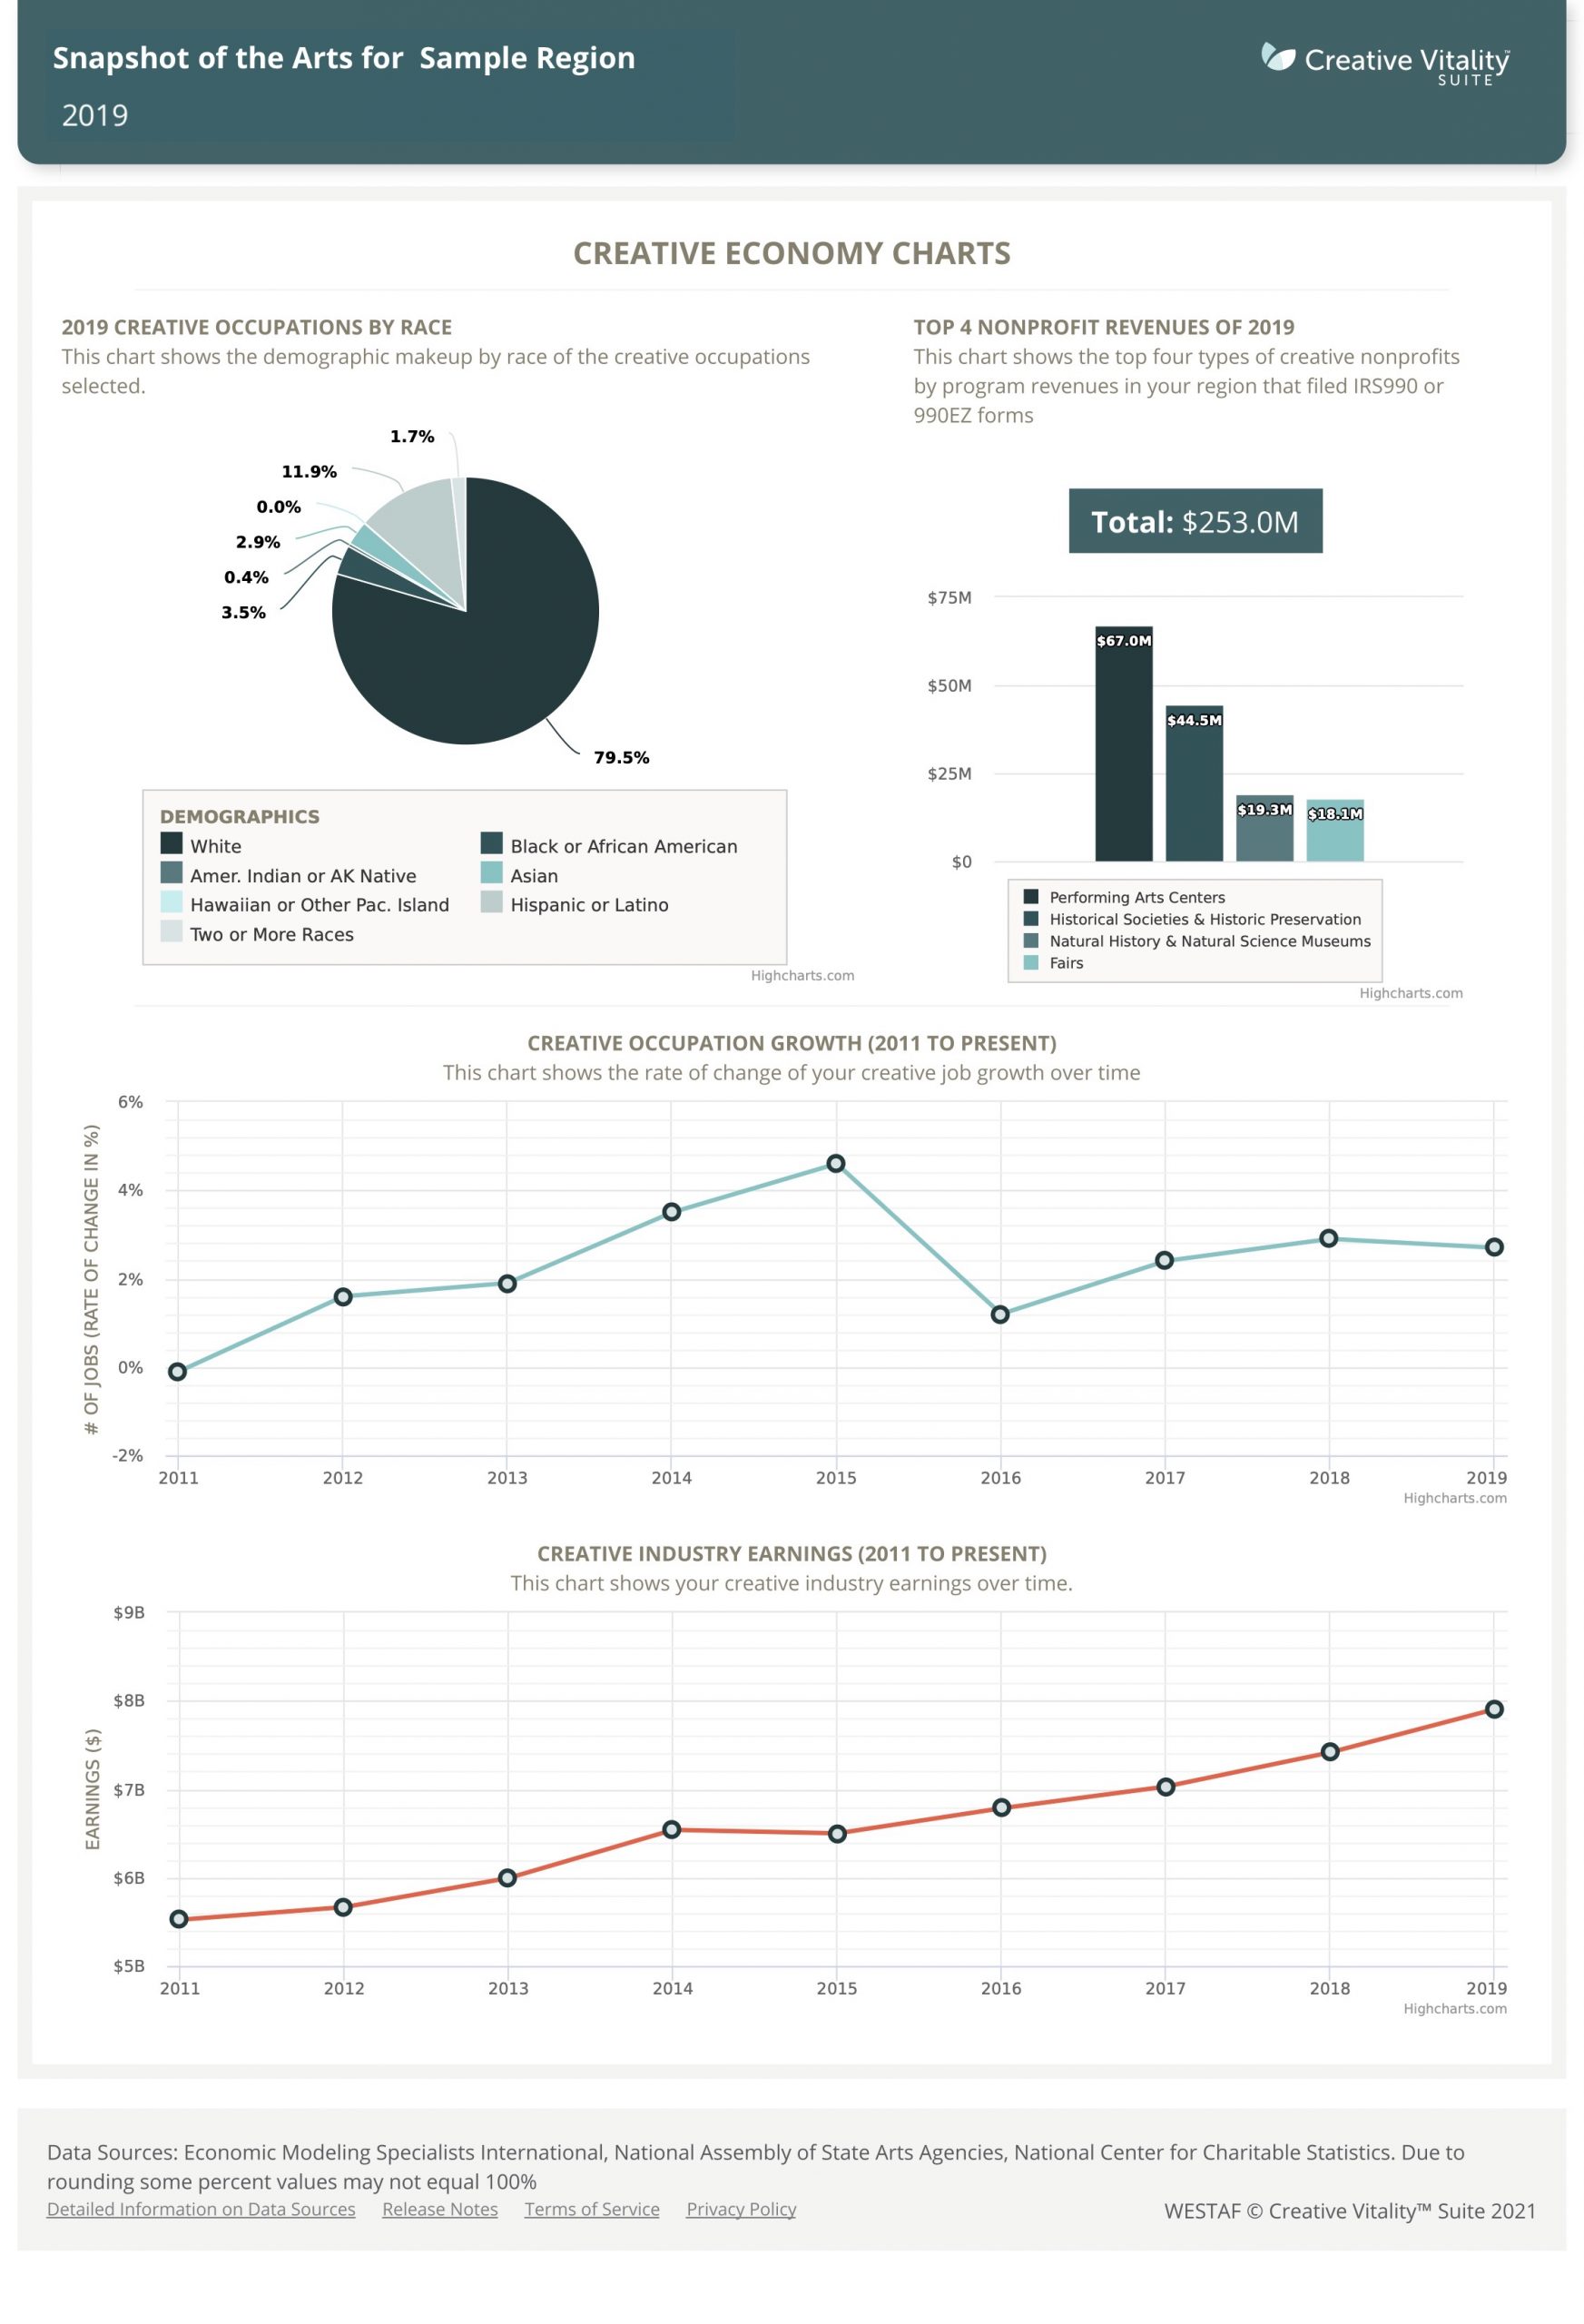
SECTION 1: CREATIVE OCCUPATIONS BY RACE
The creative occupations by race pie chart will show the demographic breakdown for your chosen creative occupations within your region (Note: If the chosen region is a ZIP Code level, demographic information will only be shown for the region, not broken down by occupation. This chart helps visualize the percentages of a population to better understand its racial distribution.
SECTION 2: NONPROFIT CHART
This barchart shows both total arts and culture nonprofit revenues for your region and program revenues for the top four nonprofit types. This chart highlights the monetary importance of the nonprofit sector.
SECTION 3: CREATIVE OCCUPATIONS GROWTH RATE
The creative occupations growth rate line chart displays how fast or slow the selected occupations are growing or contracting.
- The steepness of the line indicates a larger year over year change.
- The further the line is from zero the greater the gain or loss is at that point in time.
This information is good for determining major changes in employment by pinpointing when the changes happened. The growth rate also indicates if the growth is speeding up or slowing down.
SECTION 4: CREATIVE INDUSTRIES INDUSTRY EARNINGS
The creative industry earnings line chart displays the chosen region’s and industry’s total earnings over time. This chart will show the economic impact of your creative economy.