
NEW TO CVSUITE
Are you new to Creative Vitality Suite and ready to start exploring the creative economy data in your area? You should have received your login information from our CVSuite team. Log into the tool at https://data.cvsuite.org and follow this guide to get started.
Navigating CVSuite
There are six major sections in the site, as shown below. Click on the orange icon to see each section.

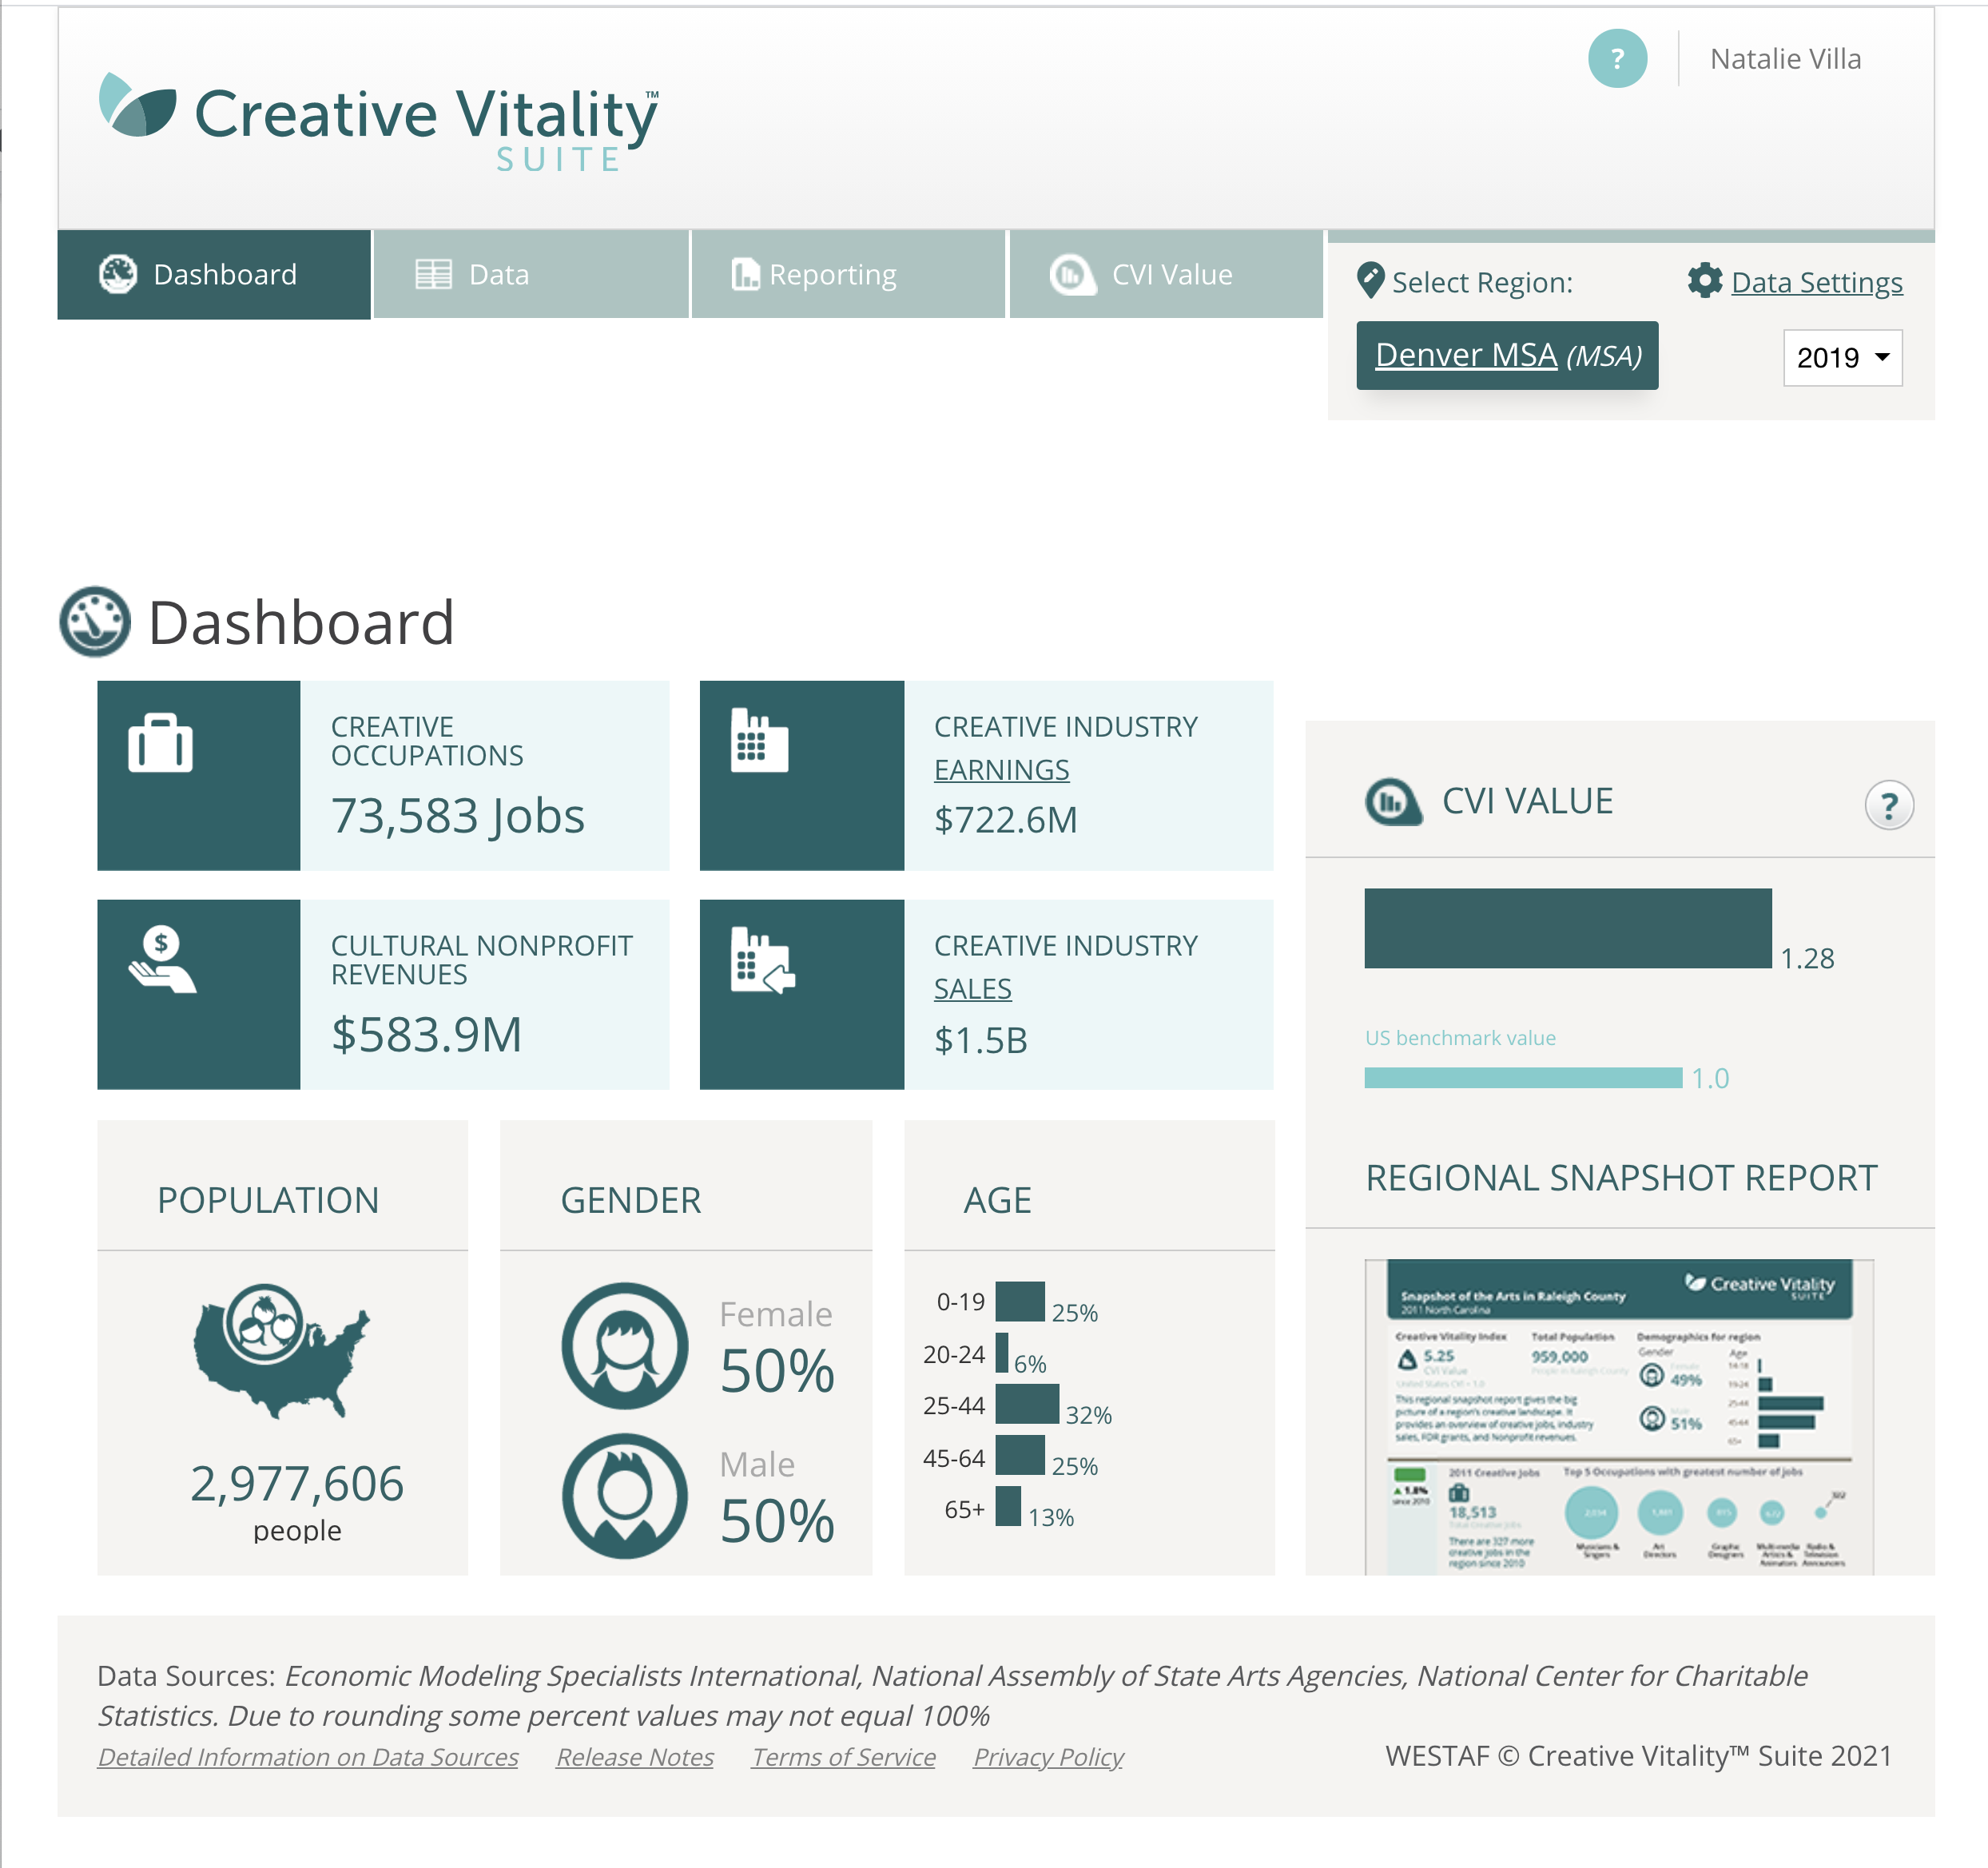
DASHBOARD
The dashboard is the default page you will access once you have logged in to CVSuite. This page lists all of the important information about your region of interest. The high-level overview shows information on the number of creative occupations, industry earnings and sales, nonprofit revenues, your Creative Vitality Index (CVI) value, and population demographics. The data will update and populate based on three elements: your region of analysis, the year of the data, and the industry and occupations defining your economy.
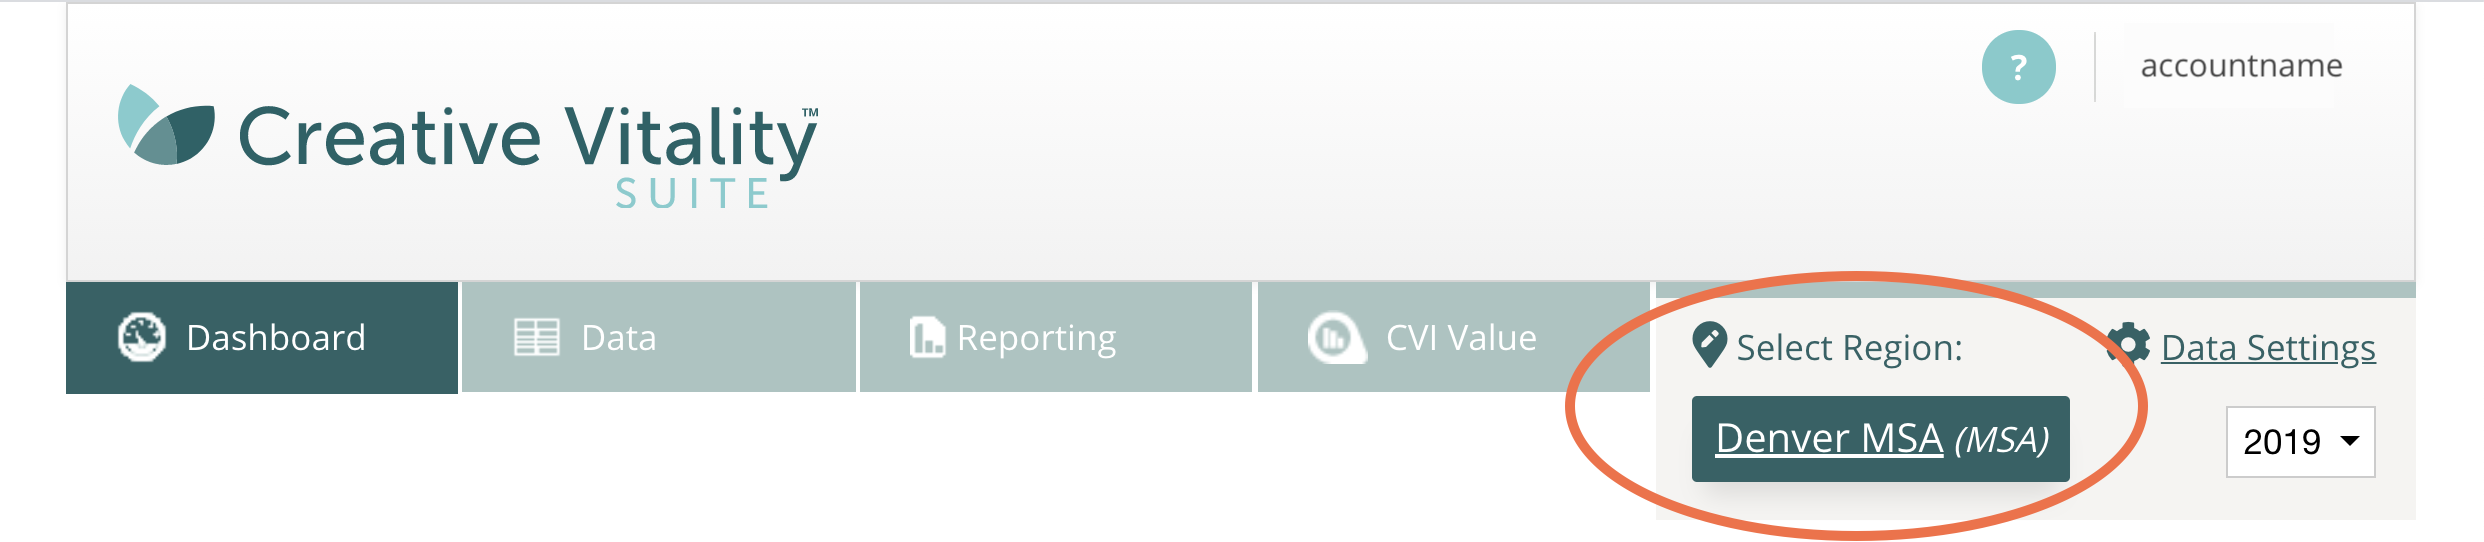
REGION SELECTION
The region selection field allows you to choose your region of interest and/or choose from previously saved regions. The region of interest is the geographic area that you would like to analyze. CVSuite offers regions at the state, metropolitan statistical area (MSA), county, or ZIP Code levels. You can look at a single geographic area, such as a state, or create a custom region by combining congruent counties or ZIP Codes.
DATA SETTINGS
With Data Settings, you can choose which industries and occupations to include in your creative economy analysis. This important step will select the data that will be included in your industry earnings and creative occupations. You can toggle on and off industries and occupations that are congruent with existing creative economy definitions, past research, or a specific creative sector.
DATA
The Data section of CVSuite provides access to all of the data in tabular and graphical formats for online and offline analysis. You can find information on creative occupations, creative industries, arts nonprofits, and population/job demographics.
REPORTS
The Reports section allows you to download our Snapshot Report, which provides a high-level overview of a region’s CVI value, population, creative occupations, creative industries, and arts nonprofit activity. The Snapshot Report is a great one-sheet to bring to internal meetings, share with local community organizers, and inform state/federal legislators. CVSuite also has four different data visualizations that can be downloaded and combined with the Snapshot Report. These charts include a breakdown of creative occupations by race/ethnicity for your region, the top nonprofit revenues for your region, the rate of growth of creative occupations, and creative industry earnings. All of these charts can be accessed by going to the Data Charts tab found in the Data section of the tool.
CVI VALUE
The CVI Value section is where users can compare the concentration of their region’s creative activity to that of other regions. The Creative Vitality Index (CVI) is a proprietary index developed by the CVSuite team. The Index uses indicators covering the for-profit and nonprofit creative economy to cover a wide range of economic activity. The indicators include creative occupation job numbers, arts nonprofit revenues, creative industry sales, and population. Find more information about the CVI here.
Defining Regions
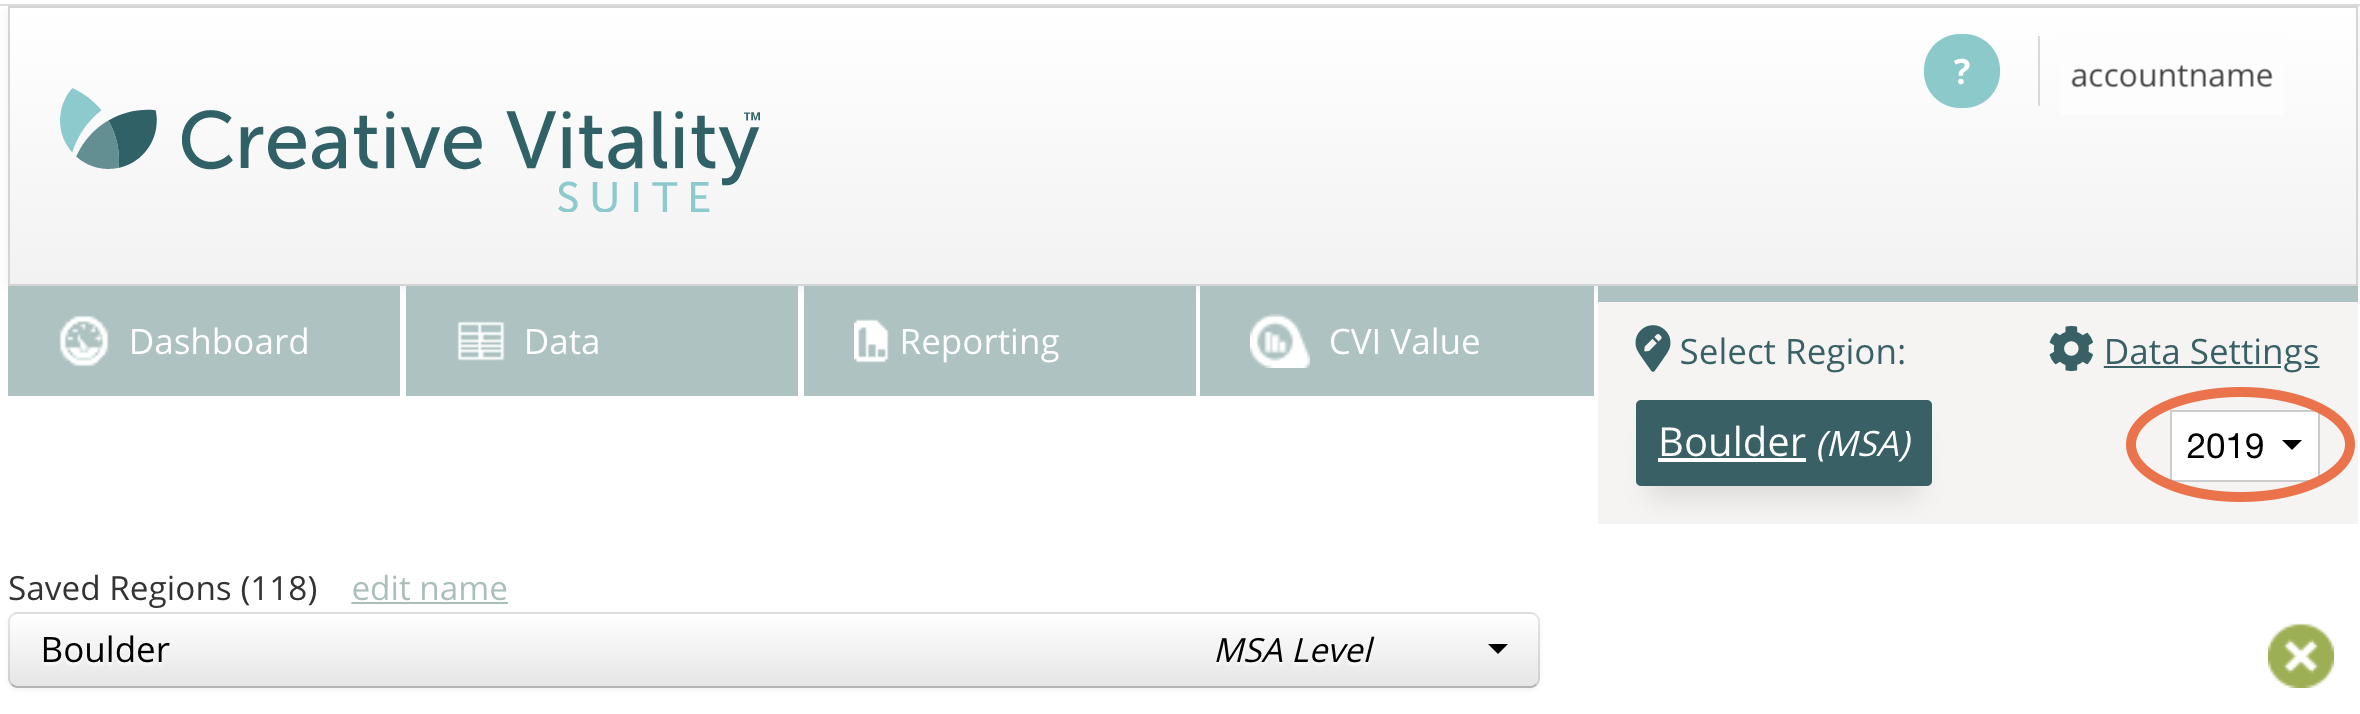
To get started using the Creative Vitality Suite, you will first need to define your region of analysis. You can do this by clicking the green “Select Region” link in the top right corner.
CVSuite offers regions available at the state, metropolitan statistical area (MSA), county and ZIP Code level.
NOTE: The regions that are available to you depend on your license permissions.
In CVSuite, you can save region groups to go back and use any time you log in to the tool. The region groups may contain a single geographic area or a combination of areas. NOTE: You may only combine states, counties, and ZIP Codes. MSAs can not be combined into a single region group. When combining multiple areas into a region group, CVSuite will aggregate the regions together and not compare the regions to each other. If you wish to compare regions, you will want to pull data for one region and then create a new comparison region and pull the data for that region.
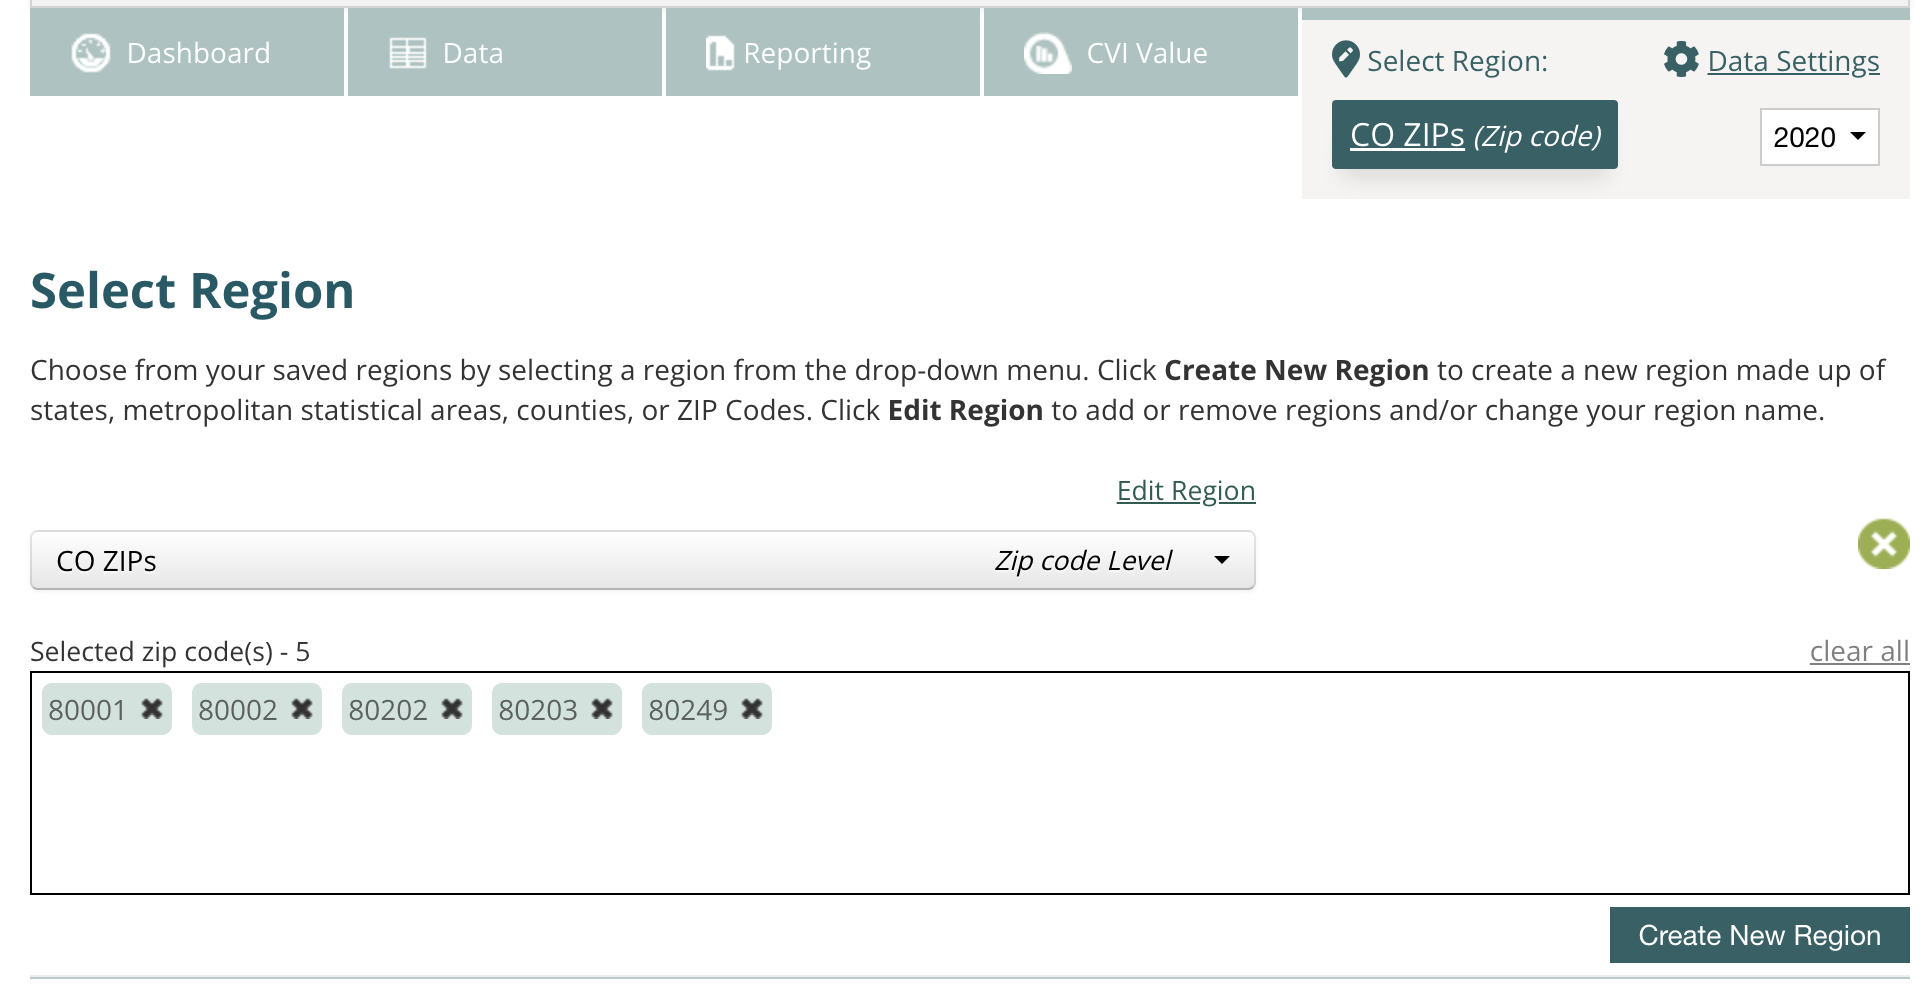
STEP 1 – CREATE A REGION GROUP
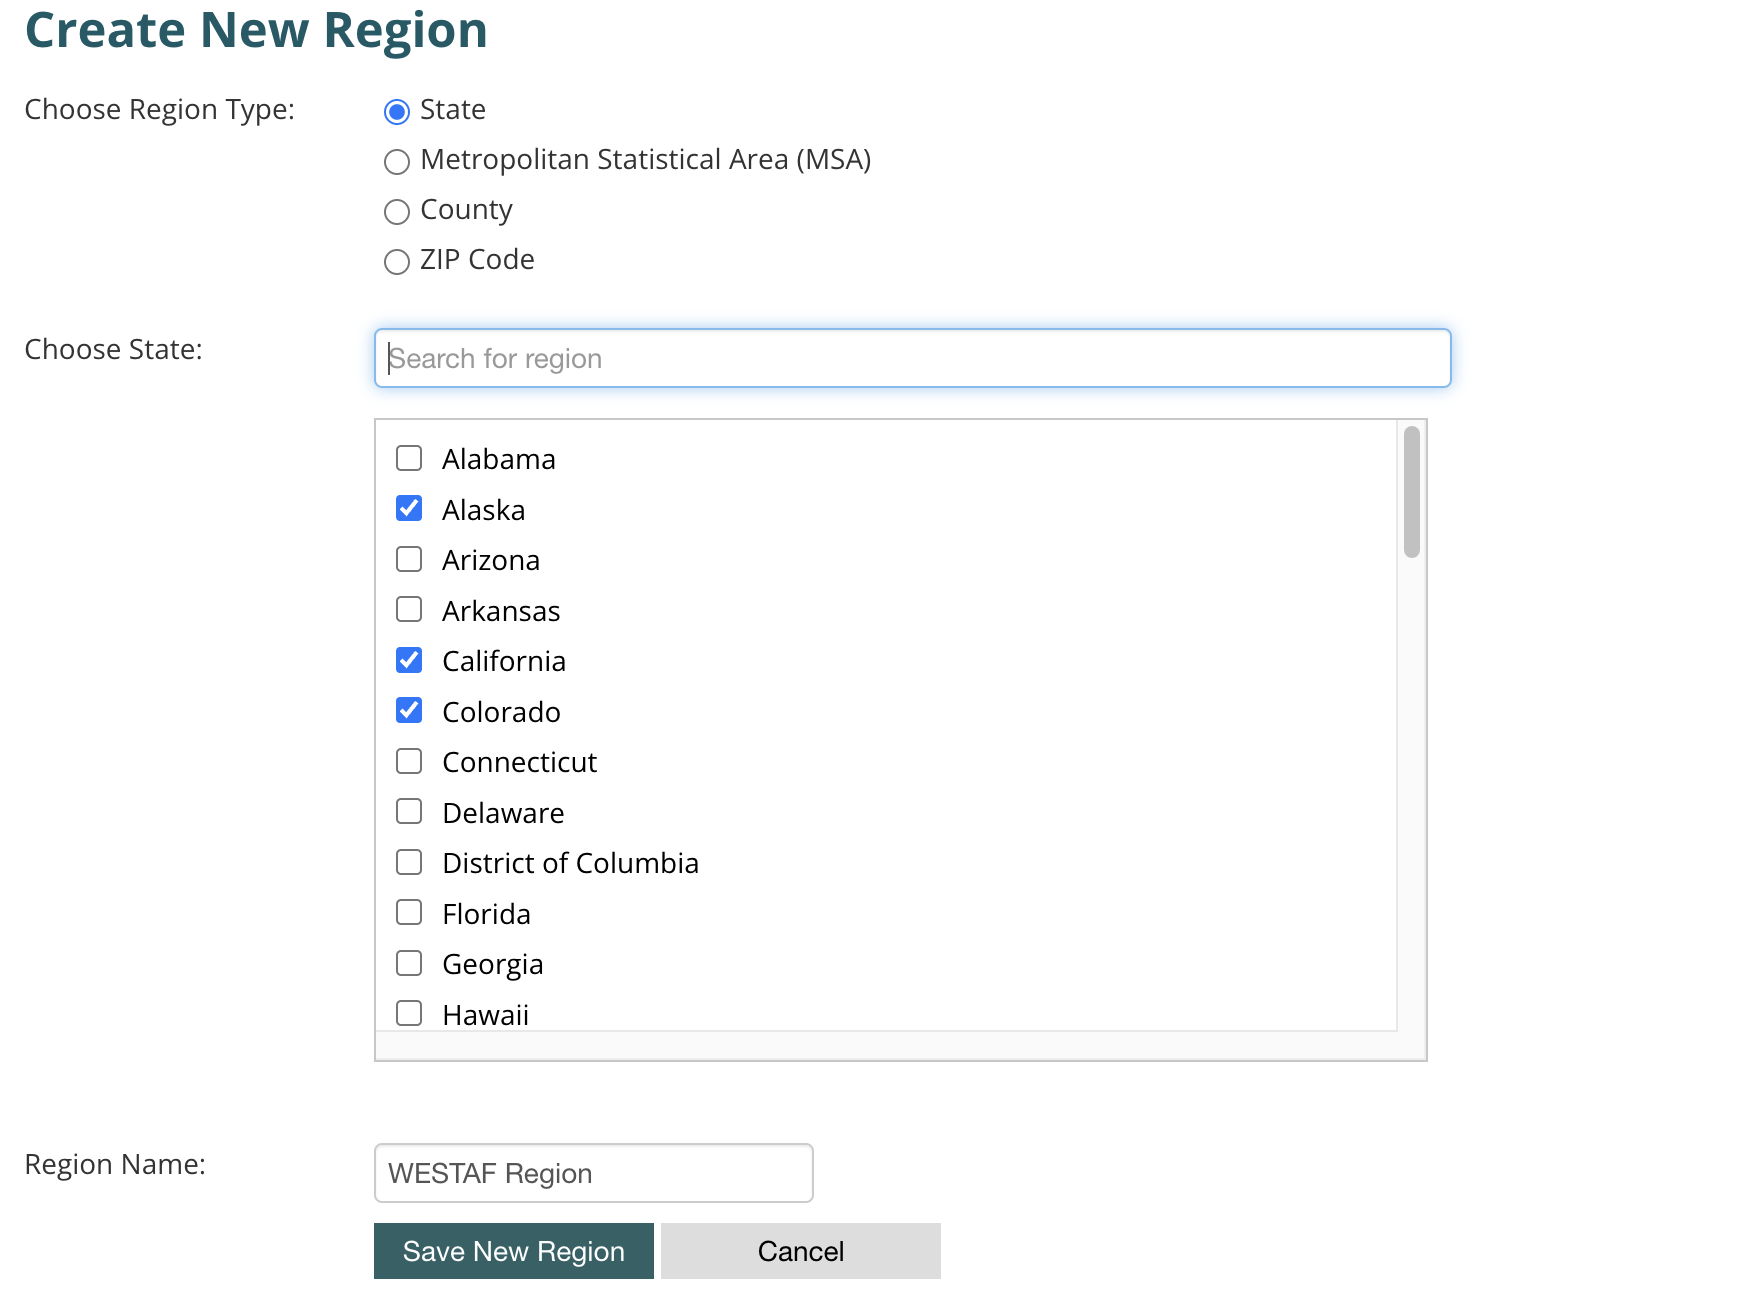
- Click the Create New Region button toward the bottom of the page.
- Choose your region type: State, Metropolitan Statistical Area, County, or ZIP Code.
- Select or search for the desired regions. Be sure to click the checkbox next to the region name.
- Enter your region name.
- Click Save New Region. Naming your region group a unique and descriptive name will distinguish this region from future and previously saved groups.
- The name of the region selected will display in the upper right corner of the tool for reference.
STEP 2 – SELECT A DATA YEAR
Select a data year by clicking on the drop-down menu under Data Settings. CVSuite offers data from 2011 to present. You can change the data year at any point of your analysis, but it is best to set your data year before you begin your analysis. The site will automatically save your selections. Click on the Dashboard or any other page to begin your analysis.
Customize Your Data
Once you have defined your region, the next step is to select your data settings. CVSuite offers you the ability to define your creative economy by choosing the creative industries, occupations, and classes of workers that will be included in your data. By default, CVSuite’s recommended core industry and occupation codes will be pre-selected. We also offer additional periphery industries and occupations that support the arts, such as culinary industries and construction industries that may be applicable to your region or particular business case. After you familiarize yourself with the data, we encourage you to evaluate the additional industry and occupation codes we offer to determine which ones are best to define your region’s creative economy. Let’s get started! On the Dashboard, select the Data Settings link.
SETTING 1 – CREATIVE INDUSTRIES
Creative industries are the industries producing goods and services within the creative economy. They employ both creative and non-creative workers. For example, a performing arts center will employ dancers and directors and also non-creative occupations such as financial officers. Select the industries you wish to analyze.
SETTING 2 – CREATIVE OCCUPATIONS
Creative occupations are occupations that utilize creative thinking, problem-solving, and/or provide services with artistic merit. These occupations are solely creative and can also be described as being core and periphery to the creative workforce. For example, graphic designers, architects, and radio announcers are all considered “creative occupations.” Select the occupations that correlate with your data needs and analysis.
SETTING 3 – CLASS OF WORKERS
Class of workers indicate the types of employment represented in the job numbers data. In your analysis, consider whether you would like to capture salaried employment such as full-time workers, self-employed workers, or workers earning secondary income from the extended proprietors’ group. The creative economy is known to be a more service-focused economy than a goods-producing one. Because creative workers often have multiple sources of income from supporting jobs and varied project interests, we recommend including all four classes of workers QCEW, non-QCEW, self-employed, and extended proprietors.
CODE GROUPINGS AND DEFINING YOUR ECONOMY
There currently is not a field-wide consensus on the definition of the “creative economy.” This can make it difficult for organizations to agree on the data they use for analysis or when comparing regions to one another. CVSuite provides the flexibility to define the creative economy based on the needs of the region. Code selection is determined not only by your creative economy definition but also by the objectives of your research. If you are interested in the music sector, you can select only music-related industries and occupations for your research. You have the power to choose which codes are relevant to your objectives, which is important to the success of your research. We recommend evaluating the industry and occupation data that are available in the tool before starting any analysis in CVSuite.
To help you get started, CVSuite has two pre-selected code groupings already built in: the CVI Code Grouping and the Primary CVSuite Code Grouping. For more information on these code groupings visit the CVSuite Data page. These groupings utilize codes that are most frequently used by our clients and/or are highly correlated with creative thinking. You can either use these groupings as-is or use them as inspiration to create your own grouping to define your region’s unique creative economy.
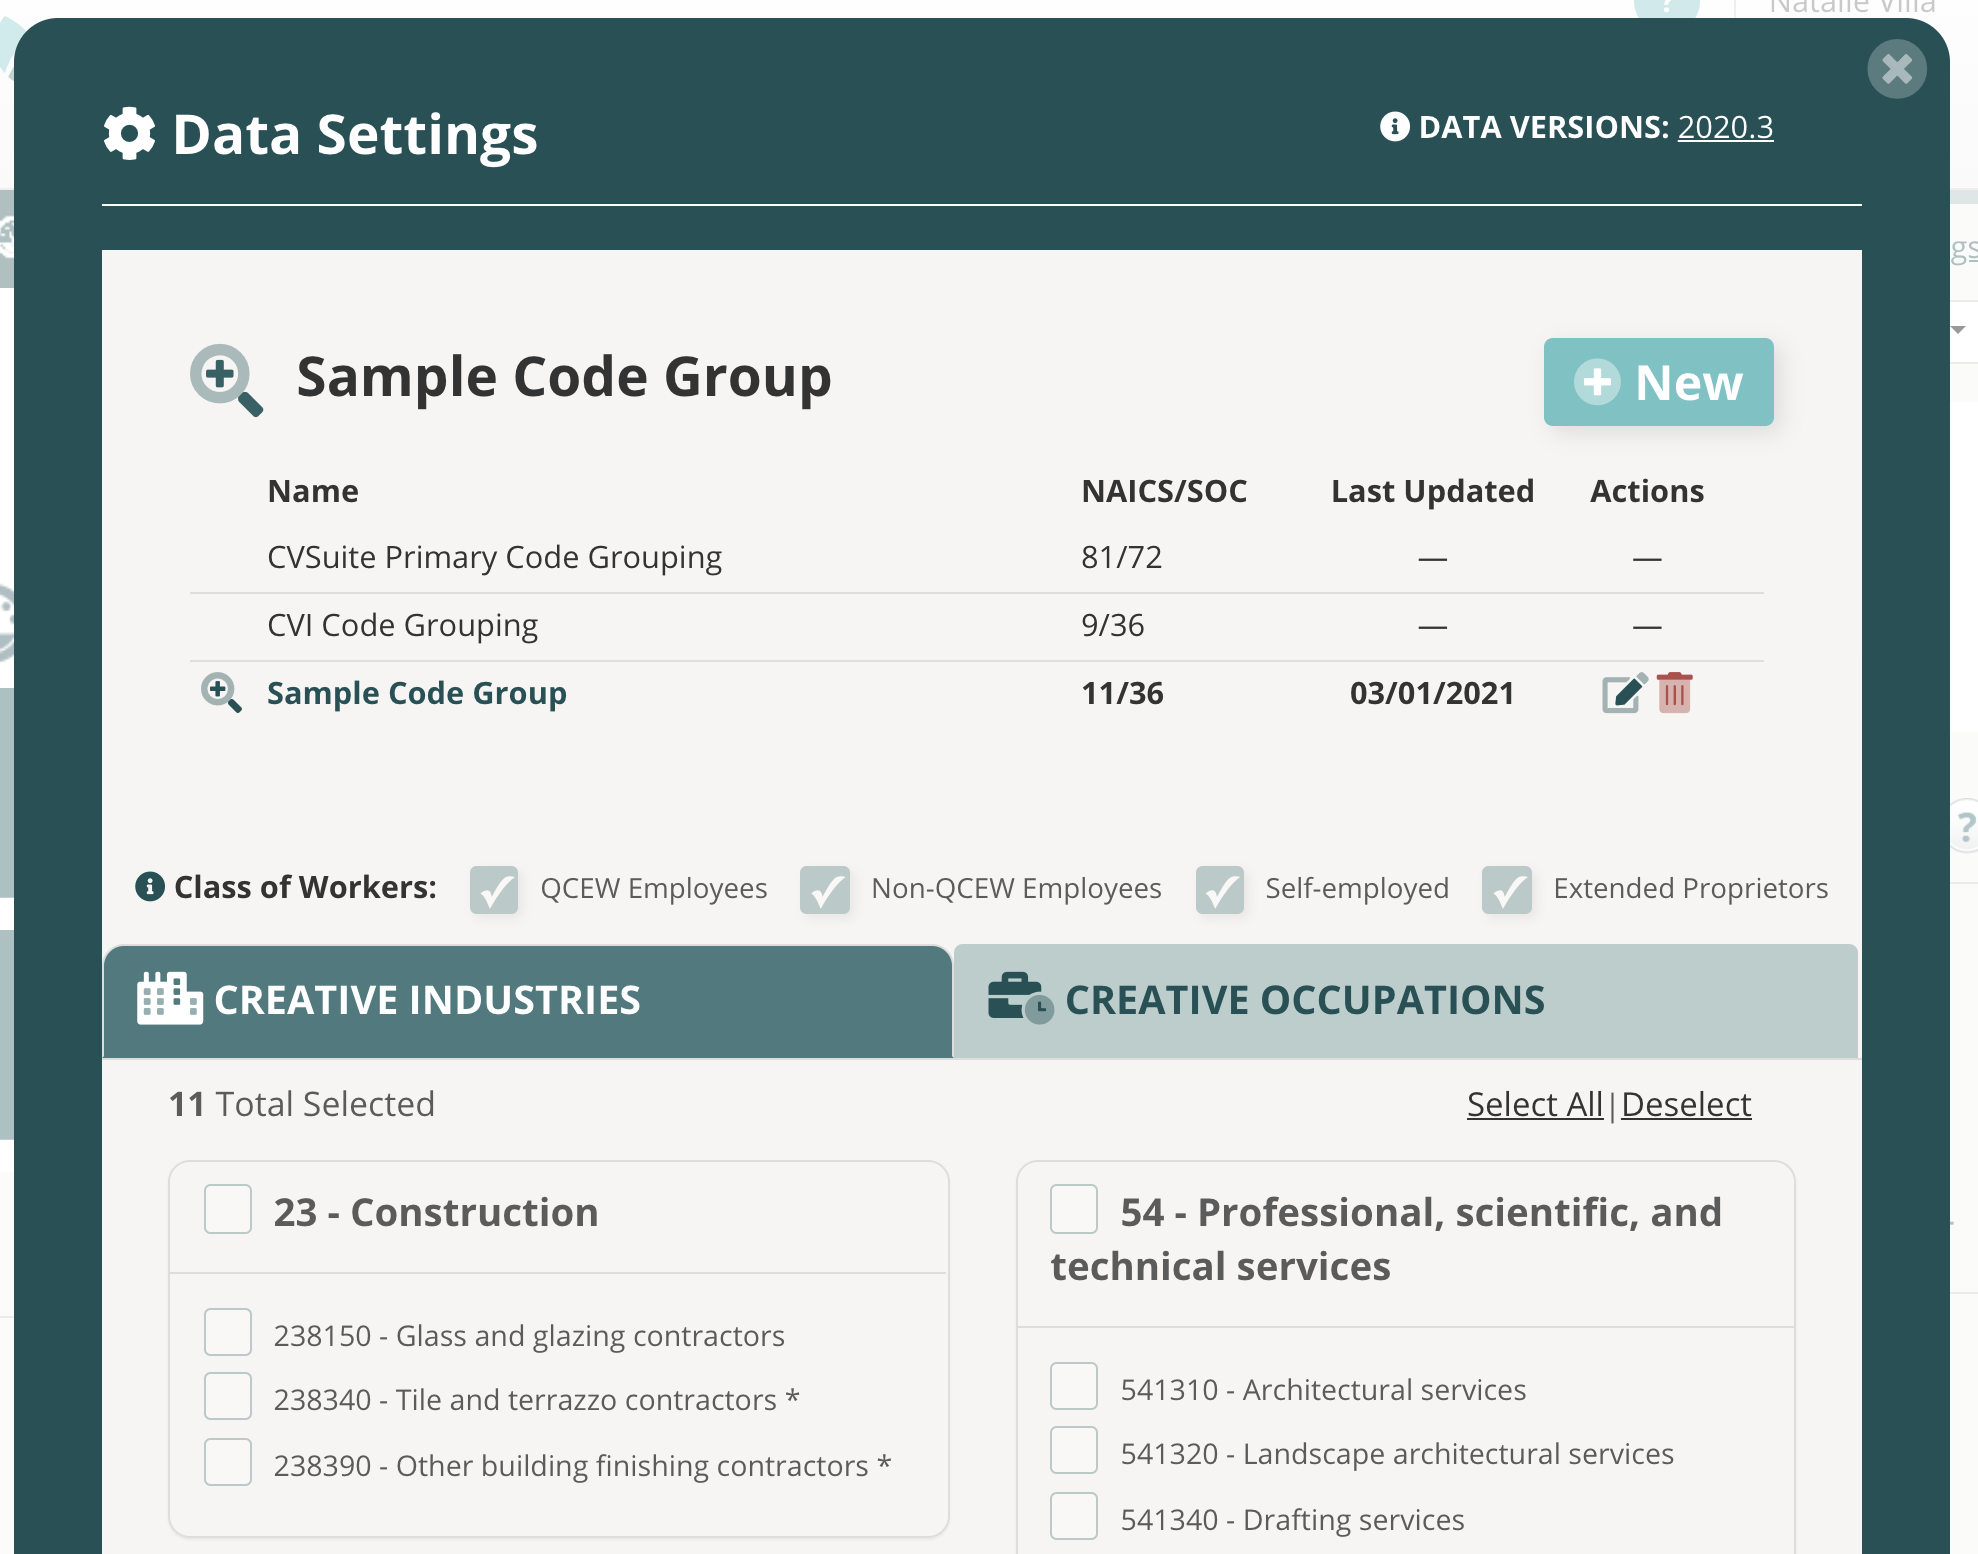
SAVING CODE GROUPS
Follow the steps below to select or create your own code grouping:
- In the Data Settings section click New.
- Name your new group.
- Choose which class(es) of workers you want to include in your analysis. Visit the CVSuite Data page to learn more about each class of workers.
- Click the Creative Industries tab, and select desired industries to include in your analysis.
- Click the Creative Occupations tab, and select desired occupations to include in your analysis.
- Click the Save button to save your new code group.

SWITCHING BETWEEN CODE GROUPS
It is easy to toggle between all of your saved groupings. Simply click the name of the grouping you wish to select and you can view all of the industries, occupations, and classes of workers within that group. Once you exit the Data Settings section, the tool will automatically load the groupings you last selected.
EDITING/DELETING GROUPS
To edit an existing code group, click the “edit” icon. Make the desired changes to the group. Be sure to click Save. To delete a group, click the red “trash” icon. After confirming, hat group will be removed from your saved groups. Learn more about the data settings in CVSuite.
DATA ON THE DASHBOARD
This is an introduction to the creative economy data offered by Creative Vitality Suite. With data on the for-profit and nonprofit creative sectors, you can analyze your region’s driving economic industries and occupations, track trends, and identify deficits. The Dashboard offers an overview of your region’s top creative economy statistics. NOTE: Remember all data on the dashboard is determined by your region, data year, and data settings selected.
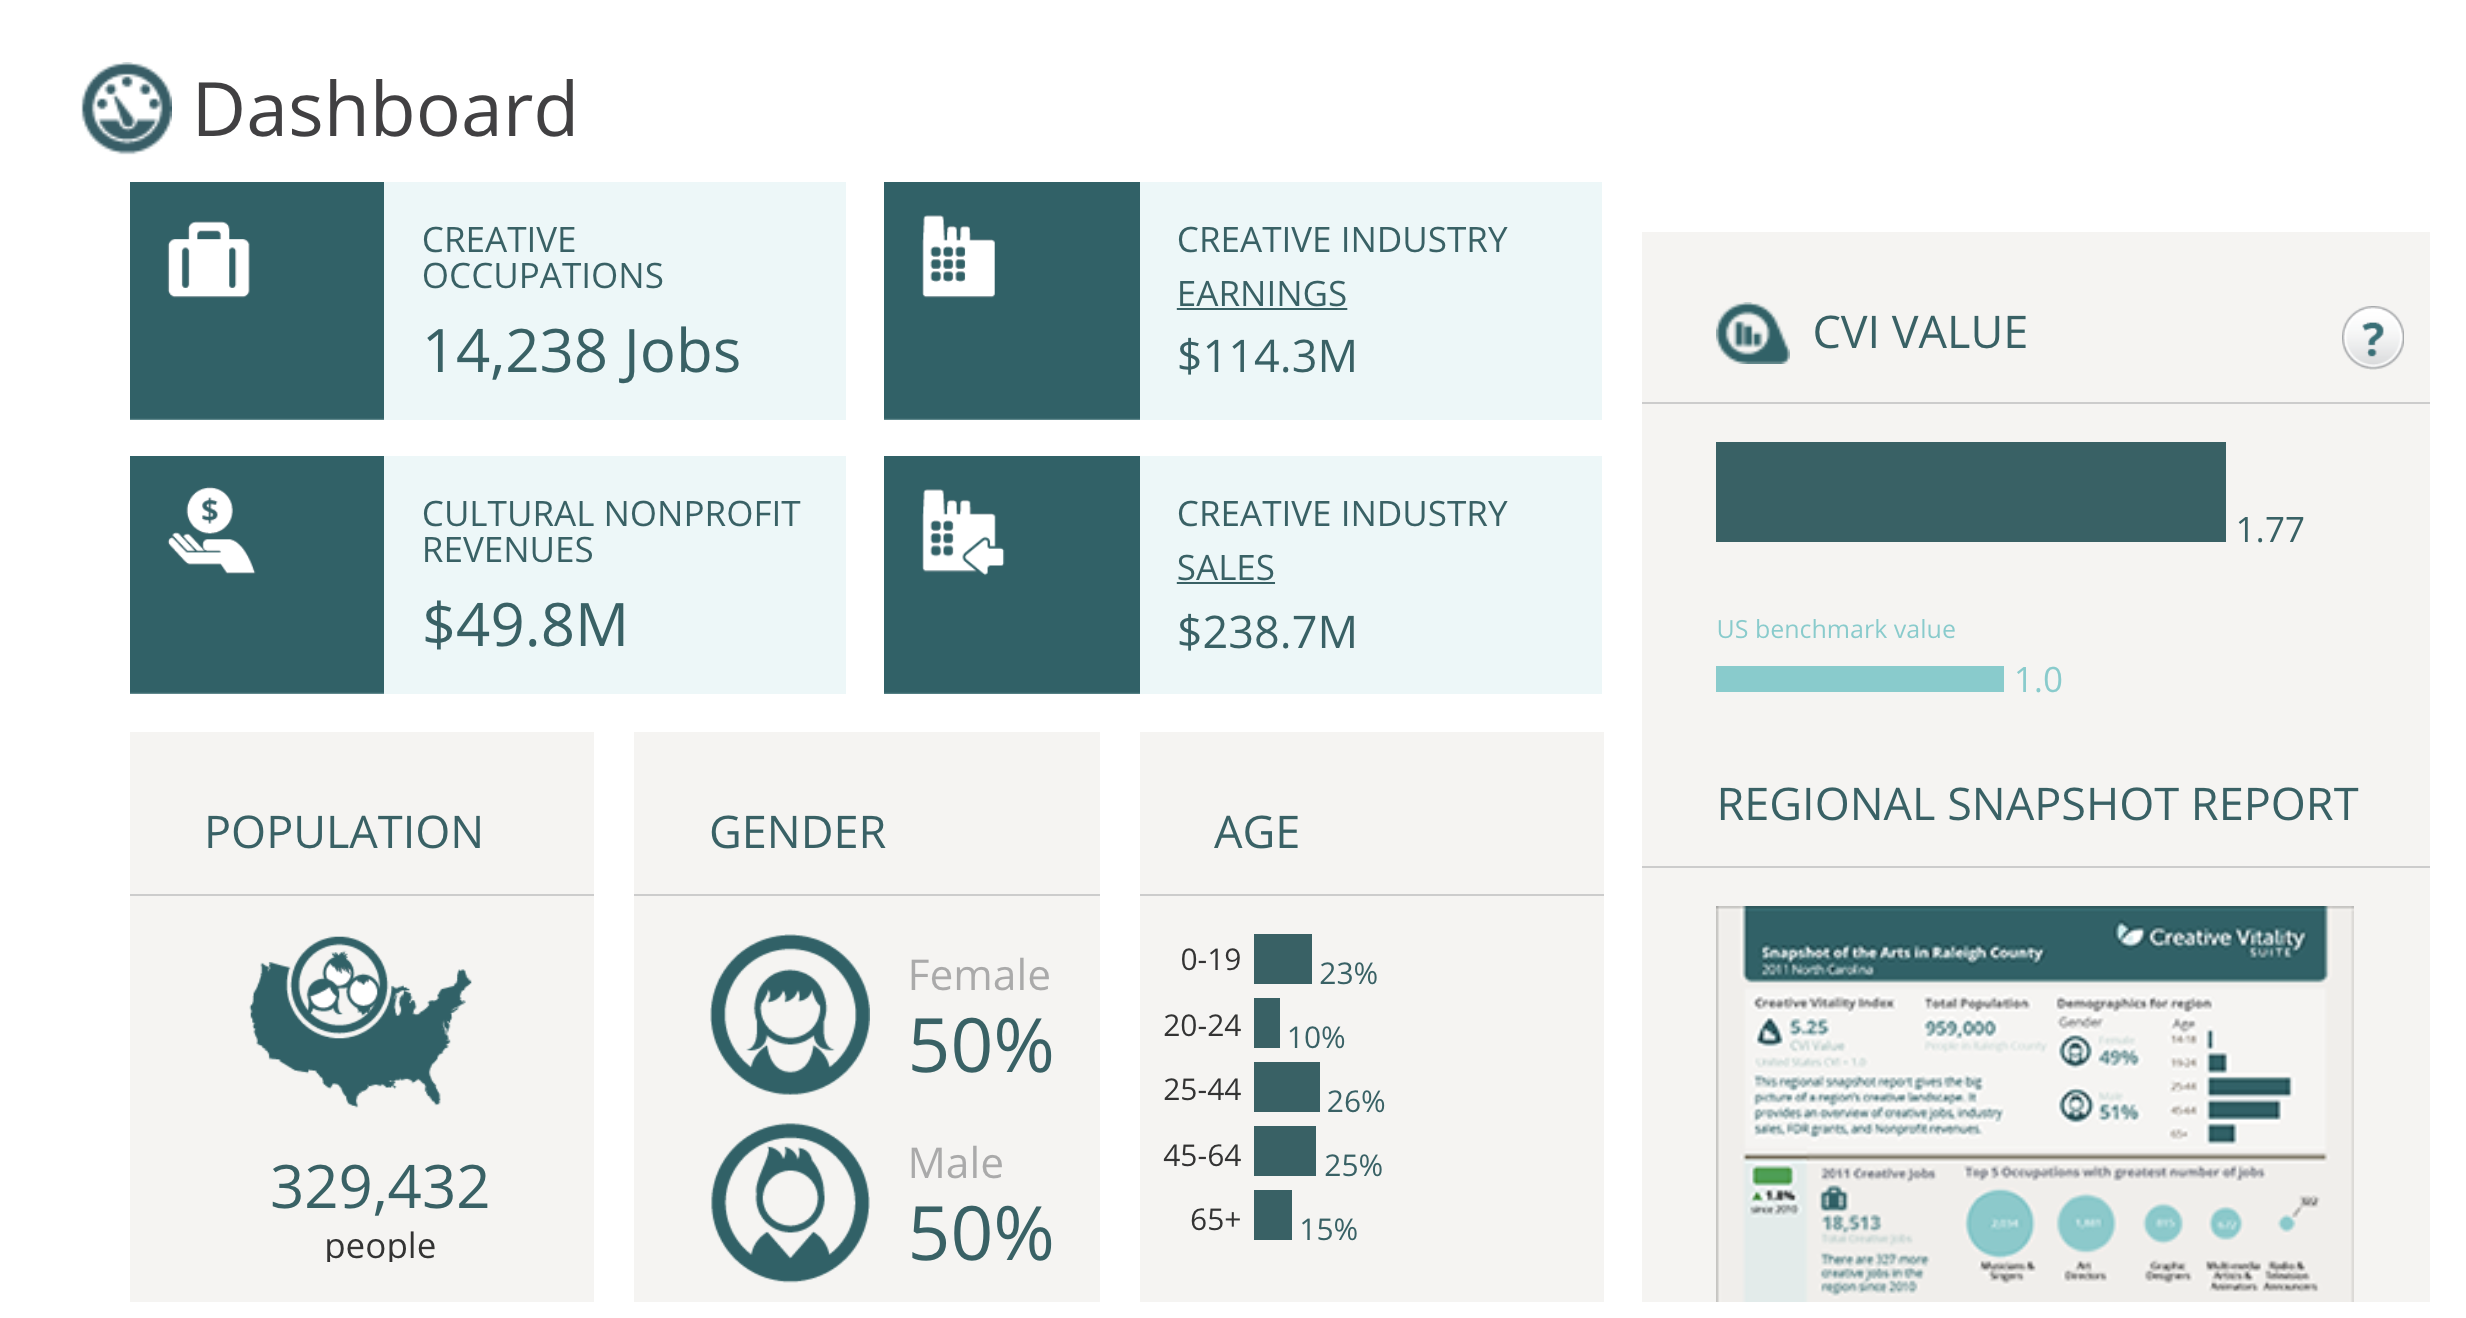
CREATIVE OCCUPATION JOBS
Creative occupation jobs are the number of skilled jobs within your region’s creative economy. In Creative Vitality Suite, a job is an instance of employment and not an actual person or worker. This is important because a person can have more than one job, such as a graphic designer who also plays in a band.
CREATIVE INDUSTRY EARNINGS
Creative industry earnings is the total amount of income that workers earn from the creative industries. The total industry earnings is a strong indicator of the number of dollars paid to local workers, which will have a stronger impact on the economy as these workers purchase common local amenities such as mortgages, gas, and food, and recirculate those dollars back into the local economy. This metric includes both creative workers (musicians, dancers, and artists) and non-creative workers (accountants, executives, and human resources).
INDUSTRY SALES
Industry sales are the number of goods and services sold by creative industries. The difference between industry earnings and sales is that sales do not always indicate dollars that will be retained within the local economy. The reason for this is because once a good is sold, external vendors must be paid, and those dollars may or may not stay within the local economy. Even though all revenue generated from sales may not remain in the local economy, sales are a strong indicator of output from industry.
ARTS NONPROFIT REVENUES
Nonprofit revenues are the amount of income generated from nonprofit arts organizations. Our revenue data come from the IRS i990 forms and help you measure the size of your nonprofit sector. When analyzing this information, keep in mind that tax forms are self-reported and only organizations with budgets of $50,000 or more are required to submit an i990.
CREATIVE VITALITY INDEX (CVI)
The Creative Vitality Index is a benchmarking index used to compare a region’s creative concentration to that of the nation. Similar to a location quotient, a CVI value greater than one indicates a concentration of creative activity that is greater than the nation. A CVI value that is less than one indicates a concentration of activity that is below the national average. The Index consists of three major indicators: creative jobs from 39 occupation groups, industry sales from 7 core creative industries, and nonprofit arts revenues. The CVI is a great way to get a high-level overview of a region’s creative economic health and trends.
DEMOGRAPHICS ON POPULATION
Demographics indicate the region’s population size, age, and gender makeup. Additional demographic information on race and ethnicity, as well as demographics on industry and occupation jobs, can be found in the Data section.
To jump deeper into the data available on CVSuite visit the CVSuite Data guide.
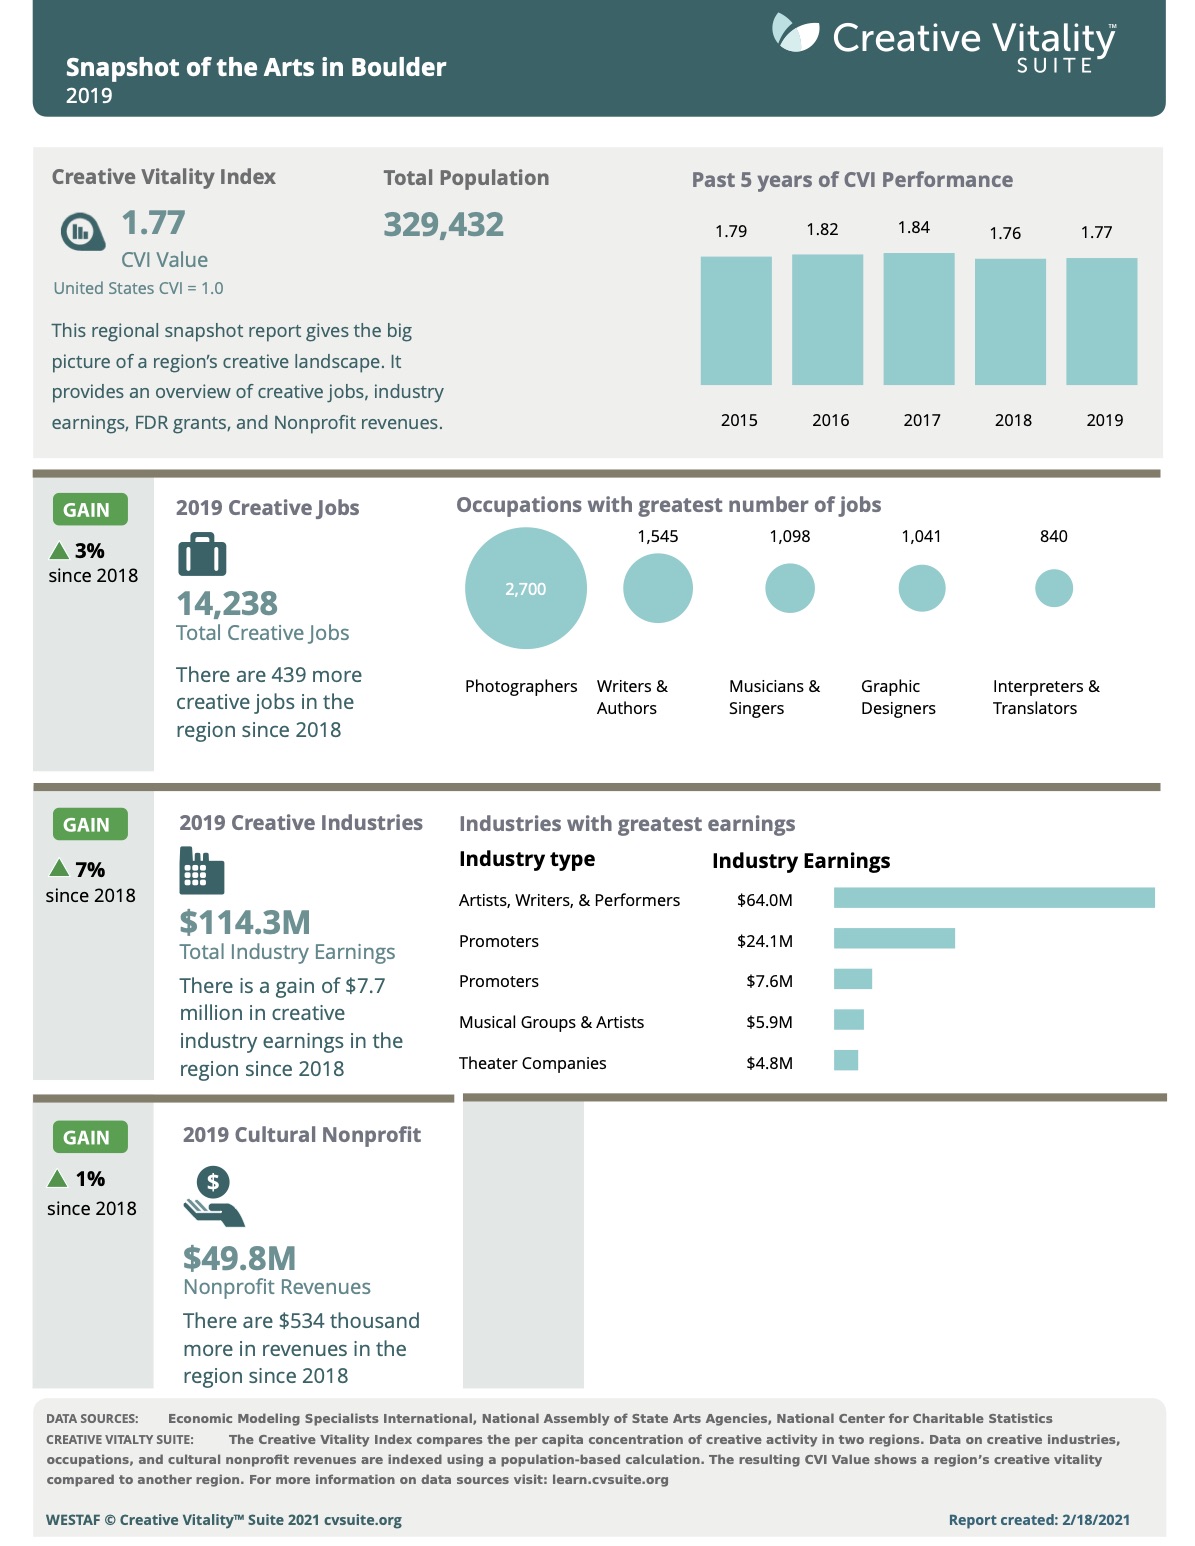
Snapshot Report
The Snapshot Report is a single-page report analyzing the major aspects of your region’s creative economy. Similar to the Dashboard, it includes information on CVI values, creative occupations, creative industries, and nonprofit revenues. There are also some additional statistics on trends and top industry and occupation groups. The Snapshot Report is a perfect report to print on-the-go for internal meetings, sharing with board members, upper management, and legislators. Snapshot Reports can be paired with the Data Charts also available in the tool to offer a full view of the creative economy in the region.
The Snapshot Report has five sections:
- CVI Value
- Creative Occupations
- Creative Industries
- Nonprofit Revenues
- Data Sources
For more on how to use the Snapshot Report visit the Reports and Visualizations page.
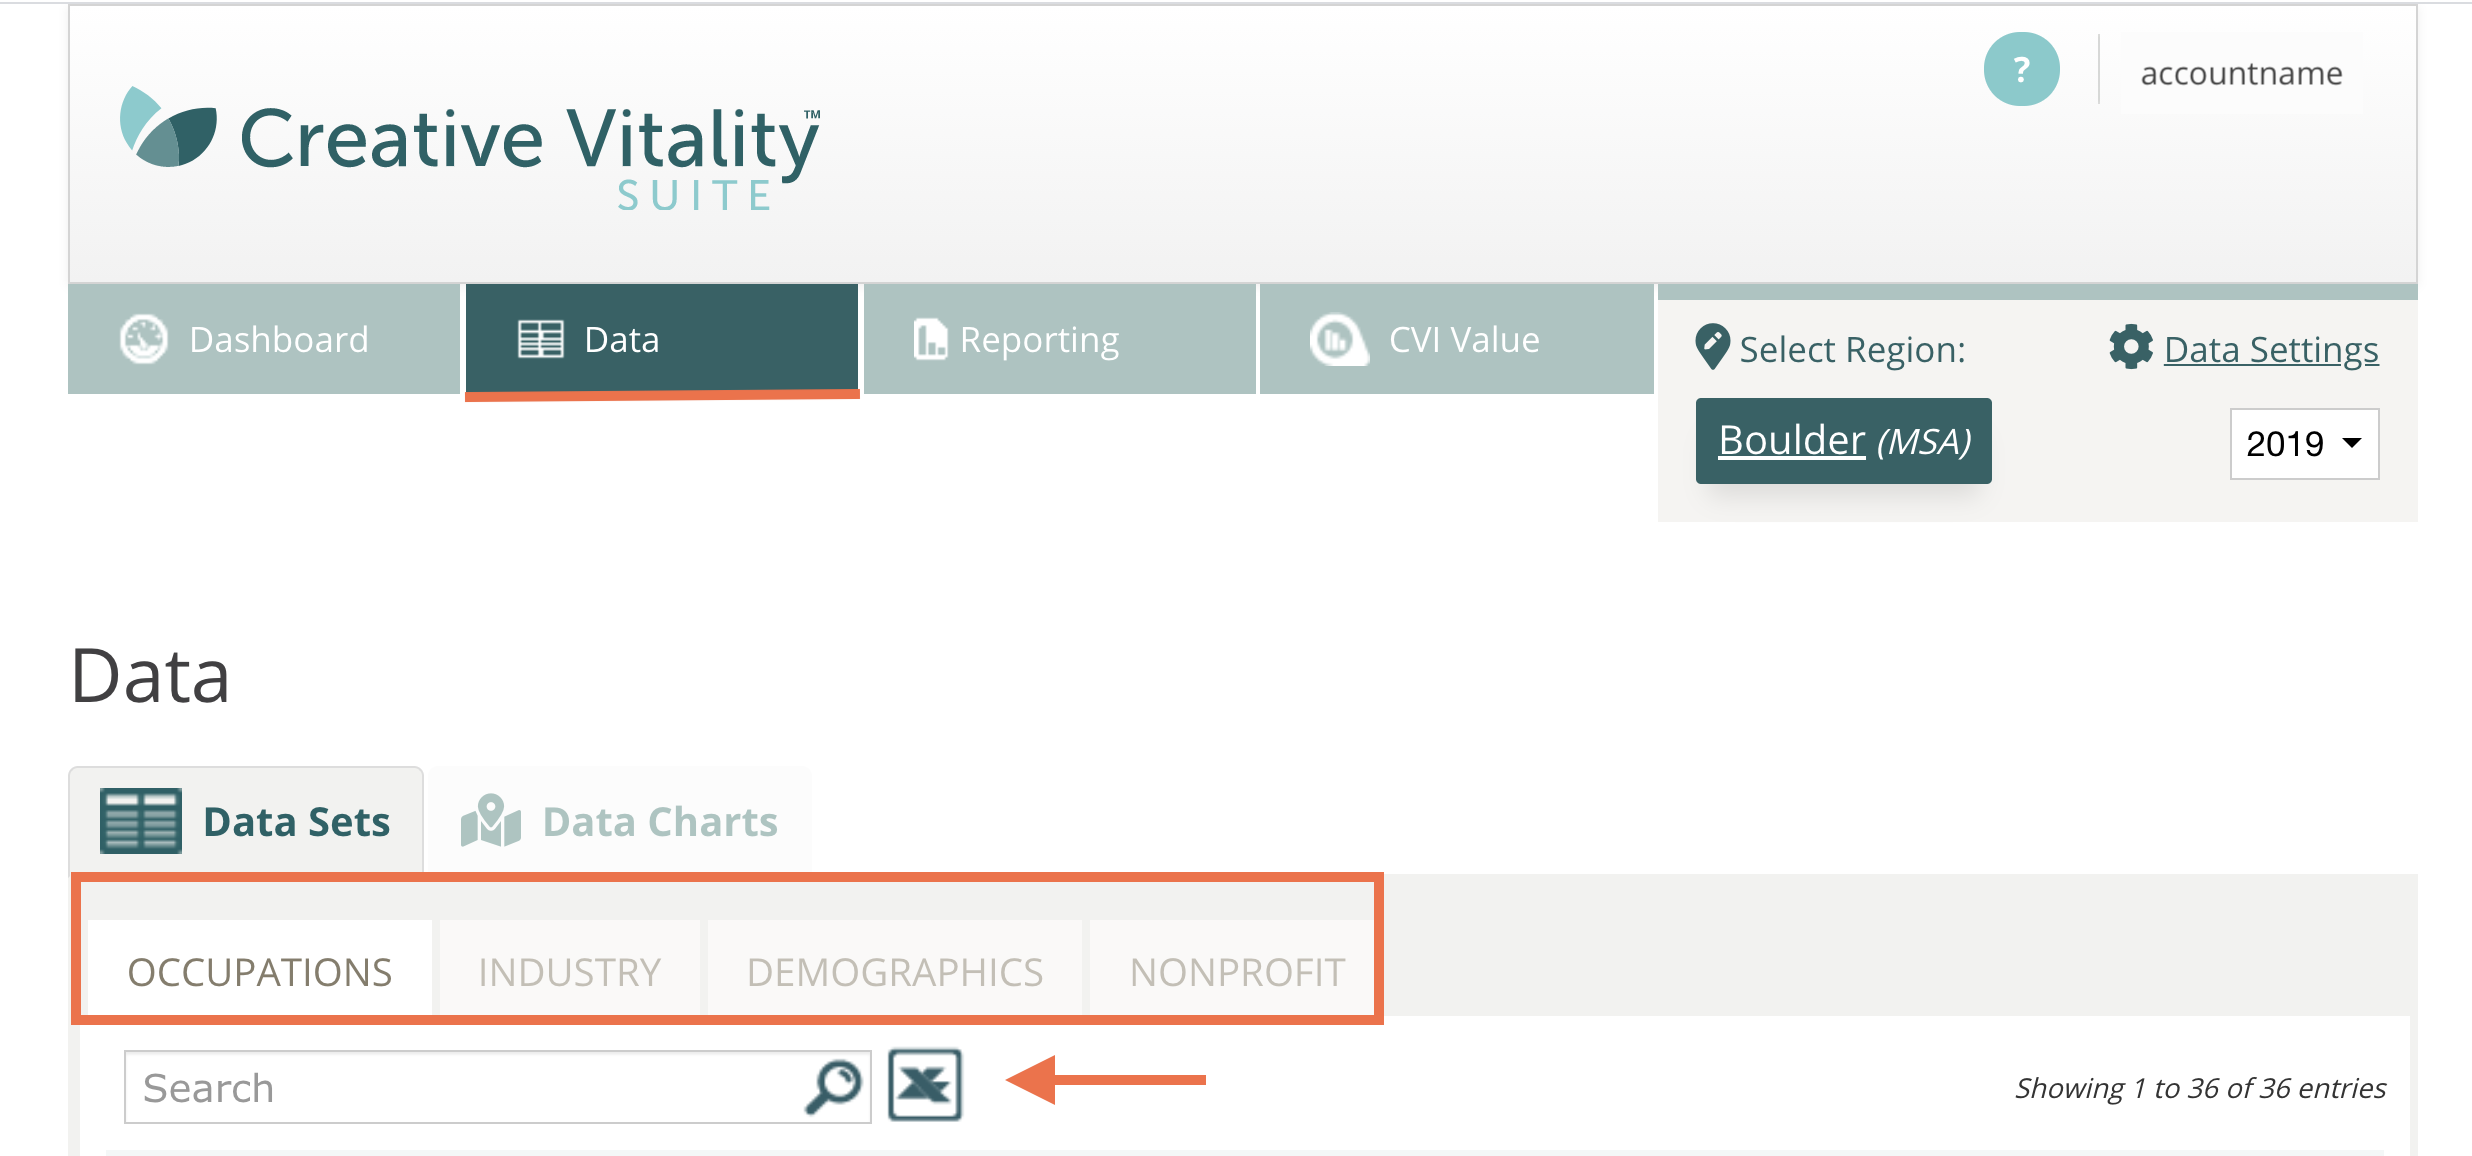
Data Downloads
CVSuite allows for deeper analysis and allows you to download the raw data into a spreadsheet. To download the data, visit the Data section and click on the Download Excel icon. You can download the spreadsheet data for occupation, industry, nonprofit, and demographic data. Keep in mind that the data is based on your settings, region, and year of data.
Each Excel download will include:
- Cover page;
- Data sheet; and
- Source page.
COVER PAGE
The cover page will include:
- Your organization’s name;
- Report type;
- Your region’s name;
- Date the report was generated;
- Timeframe of report data;
- Areas that make up your region;
- The number of SOC or NAICS Codes you’ve chosen; and
- Your chosen classes of workers.
DATA SHEET
The Data Sheet is where you will find the raw data for your chosen data settings.
Occupation data points include:
- SOC Code;
- Occupation Name;
- Start year number of jobs;
- End year number of jobs;
- Change in jobs from start year to end year;
- Percent change in jobs from start year to end year;
- Median hourly earnings;
- Average hourly earnings;
- National location quotients;
- Race/ethnicity;
- Gender; and
- Age.
- NOTE: Demographic data is not available for the ZIP Code level.
Industry data points include:
- NAICs code;
- Industry name;
- Industry sales;
- Industry job numbers;
- Earnings per job, start year;
- Earnings per job, end year;
- Percent change of earnings per job;
- Total industry earnings;
- National location quotients;
- Race/ethnicity;
- Gender; and
- Age.
- NOTE: Demographic data is not available for the ZIP Code level.
Demographic data points include:
- Race/ethnicity;
- Gender; and
- Age.
NOTE: Demographic data is not available for the ZIP Code level.
The demographic data spreadsheet includes data organized by the industries, occupations, and regions that make up your chosen area of analysis.
Nonprofit data points include:
Nonprofit data by region
- Region name;
- Program revenues;
- Contributions and gifts;
- Investment income;
- Special event revenues; and
- Total revenues.
Nonprofit data by type
- Nonprofit type;
- Number of organizations of given type;
- Percentage of share of nonprofit organizations; and
- Program Revenues for nonprofit type.
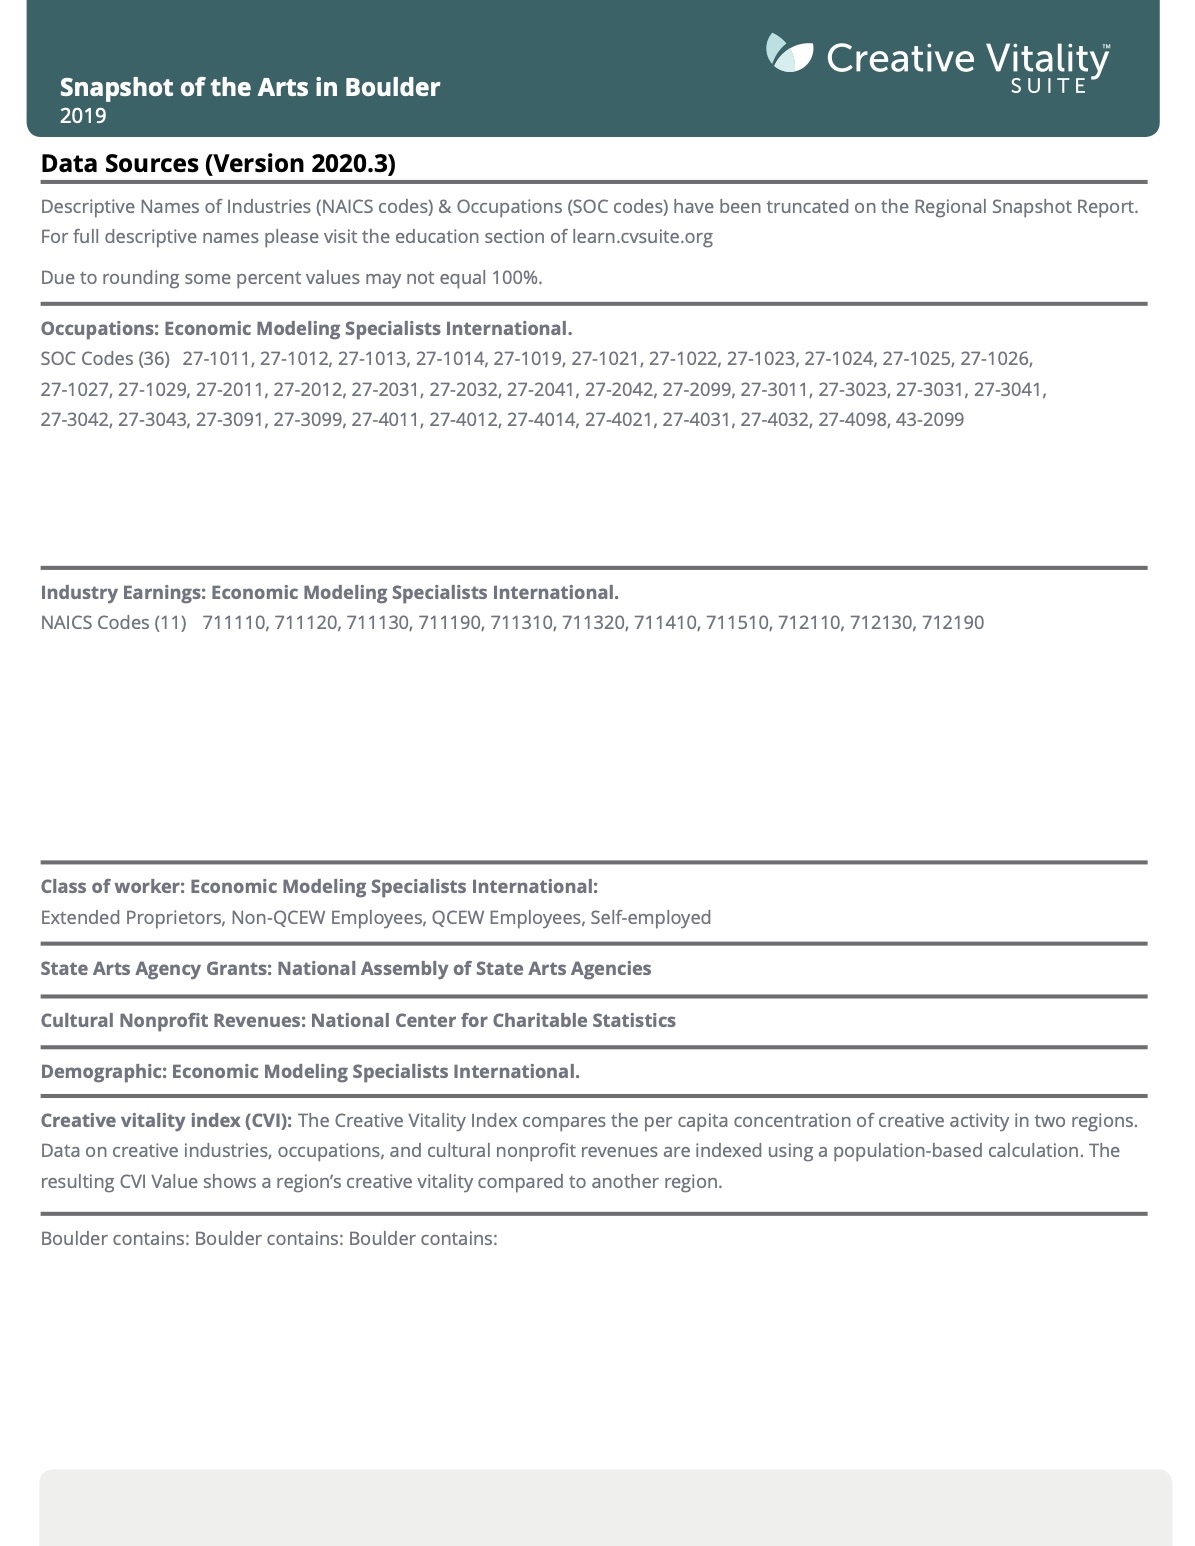
SOURCE PAGE
The Source page includes the CVSuite data version and the information needed to properly cite the data sources.
For more ideas on how to analyze CVSuite’s data, refer to the Analyzing Data page.