
CVSUITE DATA
Overview
CVSuite, in partnership with Lightcast (formerly Emsi – Economic Modeling Specialists International ), aggregates multiple streams of data into our tool to provide the most complete picture of the creative economy available. These include data from vetted and trusted government institutions such as the Bureau of Labor Statistics (BLS), the Bureau of Economic Analysis (BEA), and the Internal Revenue Service (IRS). The compiled data fall under the five distinct categories described below: occupation data, industry data, nonprofit data, demographic data, and class of workers.
1. Occupation Data (Standard Occupational Classification (SOC))
Data Provider: Lightcast
Website: https://lightcast.io/
Creative occupations are occupations that utilize creative thinking, problem-solving, and/or provide services with artistic merit. These occupations are solely creative and can also be described as being core and periphery to the creative workforce.
COMPREHENSIVE COUNT OF JOBS
CVSuite defines a “job” as an instance of employment within an occupation. Each job is categorized by one of the four classes of workers. This method of defining jobs helps capture the full spectrum of types of workers that make up the creative economy.
STANDARD OCCUPATIONAL CLASSIFICATION:
Federal statistical agencies use the Standard Occupational Classification (SOC) system to classify workers into occupational categories for the purpose of collecting, calculating, or disseminating data. All workers are classified into one of 840 detailed occupations according to their occupational definition.
You will find a listing of all occupations available in the CVSuite in the table below. In the table, you will find the six-digit SOC code, a brief description of the occupation, and a definition of the occupation. The SOC codes, occupation description, and definition are taken from the United States Bureau of Labor Statistics. More information about this topic can be found at the Bureau of Labor Statistics site.
CVSUITE SOCs
HOW THE OCCUPATIONS WERE SELECTED
The occupations offered in the CVSuite were selected based on two criteria:
- Occupations that are highly correlated with measured skill sets in thinking creatively, originality, and fine arts knowledge as measured by the Employment and Training Administration’s “O*NET” occupational network database. (The O*NET program is the nation’s primary source of occupational information)
- Input from CVSuite clients
2. Industry Data (North American Industry Classification System Codes (NAICS Codes))
Data Provider: Lightcast
Website: https://lightcast.io/
- Industry jobs are updated quarterly in May and October
- Industry revenues are updated annually in October.
Creative industries are the industries producing goods and services within the creative economy. They employ both creative and non-creative workers.
COMPREHENSIVE COUNT OF JOBS
CVSuite defines a “job” as an instance of employment within an occupation. Each job is categorized by one of the four classes of workers. For industry job counts, CVSuite considers all occupations that make up a creative industry.
NORTH AMERICAN INDUSTRY CLASSIFICATION SYSTEM CODES (NAICS CODES)
Federal statistical agencies use NAICS codes for the collection, tabulation, presentation, and analysis of economic statistics.
2022 NAICS Update
With the 2024.1 data version, the NAICS codes were updated from the 2017 definition to the 2022 definition. This update introduced new codes, combined older codes, and removed outdated codes. Below, you will find a breakdown of the changes.
New Codes
- 516210 Media Streaming Distribution Services, Social Networks, and Other Media Networks and Content Providers
- 519290 Web Search Portals and All Other Information Services
Removed Codes
- 515111 Radio Networks
- 515210 Cable and Other Subscription
- 519110 News Syndicates
- 519130 Internet Publishing And Broadcasting And Web Search Portals
Updated Codes
CVSUITE NAICS
NAICS AVAILABLE ON CVSUITE
The table below lists all industries available in the CVSuite. It includes the six-digit NAICS code, a brief description of the industry, and a definition. The NAICS codes, industry description, and definition are taken from the United States Census Bureau. For more information regarding this topic, visit the United States Census Bureau site.
HOW THE INDUSTRIES WERE SELECTED
The industries included in the CVSuite data were selected based on relevance to the creative economy and the economic contributions that these industries offer to the creative economy. Input from CVSuite clients plays an important role in the selection of industries included in the CVSuite.
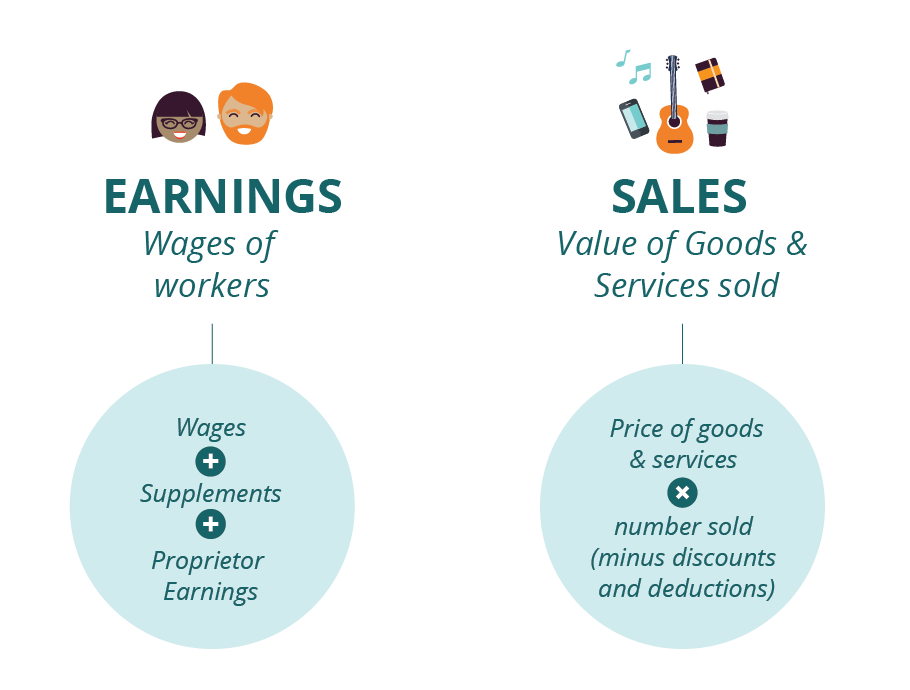
INDUSTRY EARNINGS DATA AND SALES DATA: WHAT IS THE DIFFERENCE?
CVSuite recommends that users choose Industry Earnings rather than Industry Sales data for their research. Although Industry Sales data are still available on the site, Industry Earnings data will provide CVSuite users with a more comprehensive measure of the economic impact of creative industries in their community.
It is important to make clear that Industry Sales and Industry Earnings measure two different types of impacts on the creative economy:
INDUSTRY SALES
Sales (also referred to as “revenue”) are calculated by multiplying the price at which goods or services are sold by the number of units or amount sold. Industry sales is comprised of the amount of money that companies in a given industry actually receive during a specific period, minus discounts and deductions for returned merchandise. It is the “top line” or “gross income” figure for an industry from which costs are subtracted to determine “net income.”
INDUSTRY EARNINGS
Industry Earnings are defined as the labor compensation paid to all the workers in a given industry. Amounts are reported as average earnings per job for the most recent year of data only. If the most recent year of data is not the current year, then earnings are “brought forward” into the current year using the most recent job/earnings ratio combined with Emsi’s current-year jobs estimate. In some public data sources, such as BEA’s SPI/LPI and BLS’s QCEW, industry earnings are simply called “wages.”
For a deeper dive into CVSuite Sales vs. Earnings data, read: CVSuite Data Dives: The Key Differences Between Industry Sales and Earnings Data.
3. Demographic Data
Data Provider: Lightcast
Website: https://lightcast.io/
Demographics show the region’s population size, age, and gender makeup. Additional demographic information on race and ethnicity, as well as demographics on industry and occupation jobs, can be found in the Data section of the CVSuite tool.
SOURCES OF DATA
Demographic data are made available via the U.S. Census Bureau’s Quarterly Workforce Indicators (QWI) and American Community Survey (ACS). While QWI data provide workforce demographics for industries only, we also use ACS and staffing patterns to derive occupational estimates. Race/ethnicity data include the region, as well as both job totals for occupation and industry.
The race/ethnicity categories, available in CVSuite, are as follows:
- White (not Hispanic or Latino)
- Black or African-American (not Hispanic or Latino)
- American Indian or Alaska Native (not Hispanic or Latino)
- Hispanic or Latino
- Asian (not Hispanic or Latino)
- Native American or other Pacific Islander (not Hispanic or Latino)
- Two or more races (not Hispanic or Latino)
4. Nonprofit Data (National Taxonomy Exempt Entities (NTEE))
Data Provider: Urban Institute’s National Center for Charitable Statistics (NCCS) | Updated annually in July
Website: http://nccs.urban.org/
Types of nonprofit cultural organizations included: 44
Nonprofit data in CVSuite includes program revenues, contributions and gifts, and total revenues for arts and culture organizations.
NATIONAL TAXONOMY EXEMPT ENTITIES CODES (NTEE)
The IRS and NCCS use NTEE codes to classify nonprofit organizations. Below you will find a listing of nonprofit cultural organizations included in CVSuite. The NTEE code uses a combination of letters and numbers to classify organizations. For example, when you see “A51,” the “A” refers to the primary classification category (art) and the “51” refers to the type of nonprofit organization (museum). Thus, “A51” is the NTEE code given to art museums. For additional information about NTEE codes, visit the National Center for Charitable Statistics website.
HOW OUR NONPROFIT DATE IS COLLECTED
Nonprofit data in CVSuite is provided by the National Center for Charitable Statistics. Organizations that are required to complete either the IRS Form 990 or Form 990-EZ are captured in these data. Nonprofit data found in CVSuite from 2012 or earlier will only include nonprofit organizations generating an income of $25,000 or more annually. Nonprofit data found in CVSuite after 2012 will only include nonprofit organizations generating an income of $50,000 or more annually.
CVSUITE NTEE
Class of Workers
CVSuite covers the full spectrum of employment types, from full-time workers, such as those measured by state labor departments, and part-time and self-employed workers. Use the “data settings” function in the CVSuite to select between these different “classes” of workers.
4 TYPES OF EMPLOYMENT IN CVSUITE
1. Quarterly Census of Employment and Wages (QCEW)
The QCEW class of workers represents full-time employees. This is simply unsuppressed QCEW data and will closely resemble what you would get from your state labor market information office. This means that any employment number that QCEW publishes will show up in our tool as the exact same number. Anyone who needs Emsi numbers to stick closely to Bureau of Labor Statistics QCEW numbers will have employment numbers that match.
2. Non-QCEW Employees
The Non-QCEW data represent the part-time employees. This set consists of other groups of employees who are not captured by QCEW data, but who still count as employees. These include railroad, military, some non-QCEW federal government workers, unemployment insurance exempt nonprofits, and a few other miscellaneous categories. These data are particularly helpful for evaluating those tricky military and government sectors that can dominate regional economies.
3. Self-Employed
These are self-employed workers who count their self-employed work as their primary source of income. Including these workers alongside our more traditional data sets will give you a more complete picture of your region’s employment numbers.
4. Extended Proprietors
These are workers who are counted as proprietors but classify the income as peripheral to their primary employment. Many industries (primarily oil and gas extraction, finance and insurance, and real estate) include people who are considered sole proprietors or part of a partnership, yet have little or no involvement or income in the venture. An increasing number of people fall into this category (e.g. those who do freelance work on the side, like writers or musicians), and now you will be able to identify these types of workers more clearly.
Data Updates
Keep in mind that our data provider, Lightcast, models occupational data from more than 80 different public and proprietary sources. Lightcast updates its occupation data quarterly based on when the data sources it uses in its model are updated. When these updates occur, previous data are also adjusted.
So what does this mean for you? First, you will notice that the updated data in the tool will look different after they have been updated. For example, 2012 job numbers from the quarter one data update might look different than 2012 job numbers from another year’s data update. By offering multiple data sources from Lightcast, CVSuite provides you with the most complete picture of your area’s creative jobs. Having just one data source is not enough to measure the complex features of your creative job market. CVSuite’s data sources work in tandem with each other, filling in the gaps that would be left by using only one data stream.
These types of quarterly updates are considered a data best practice. Having access to the most current, accurate numbers provides a better understanding of the creative workforce in your region. Visit the Methodology & Release Notes page for more information on the current data.
2024.1 NAICS Code Update FAQ
The North American Industry Classification System (NAICS) is the standard used by Federal statistical agencies to classify businesses into specific industry sectors.
25 codes are being added, removed, or modified. Take a look at the list of codes and how they’re changing here. Take a look at the list of codes and how they’re changing here.
The Census updates the code definitions every 5 years to ensure it’s relevant, accurate, and timely.The modification of NAICS codes could be due to changes in industry trends, emerging sectors, or updates to reflect the evolving business landscape.
The 2017 NAICS definitions will no longer be accessible. We will automatically update your previous code groupings. We encourage you to review your saved code groups. Data for the new 2022 NAICS codes will not be available for 2011 – 2020. Learn about the changes here.
We also updated the methodology for the CVI to reflect the new 2022 definitions for 2021 and 2022. CVI values pulled prior to 2021 will use our older methodology. Learn more about our CVI methodology shift here.
Industry sales data will not be available for the new 2022 NAICs codes for 2011-2020. You can access all CVI values but values 2011 – 2020 will use our older methodology.
- The changes to the NAICS codes impact the code grouping selected in the Data Settings section. CVSuite will automatically update your current code groups. Newly introduced codes have not been added to your custom groupings.
- We recommend reviewing the NAICS codes included in your groupings after the update to see what has changed and where you may need to make modifications. See this blog outlining the changes you can expect to see.
Only temporarily. The site will be unavailable from 5 p.m. MDT on Monday June 24 to Noon MDT on Tuesday 25, 2024.