
When taking on the–sometimes difficult–task of quantifying an area’s creative economy, you will want access to every tool at your disposal. One useful tool is location quotient (LQ) data. The location quotient can be used to reveal the level of concentration a particular occupation or industry has in a specified geographic area compared to the national average. As such, it is a very valuable tool in determining what makes your regional creative economy unique.
Defining Location Quotient (LQ)
In the article “Understanding Location Quotient,” our data provider, Economic Modeling Specialists International, does a deep dive analysis of LQs and explains how they can be used in industry and demographic studies. For example, if you are looking for data on a creative occupation, the LQ will show you how the concentration of that occupation in a specific region compares to its concentration nationwide. Let’s say you need information on dancers in Minneapolis. The LQ for actors in Minneapolis is 4.23, which means they are over 4 times more concentrated in the region than they are nationally.
What Location Quotient Tells You About Your Creative Economy
Industry LQs can provide information about which businesses are economically important to a region. A high LQ coupled with high total job numbers indicate an industry is a meaningful part of a region’s creative economic base. Alternately, a low and/or declining LQ paired with low or lowering employment numbers can indicate a negative shift in creative economic activity. Thus, at a glance, location quotient shows the density of creative occupations in a certain region and provides insights into what makes an area’s creative economy unique. This information can then be used to inform planning and other decisions that will help creative communities flourish.
An Example: The Minneapolis Creative Index 2013 Report
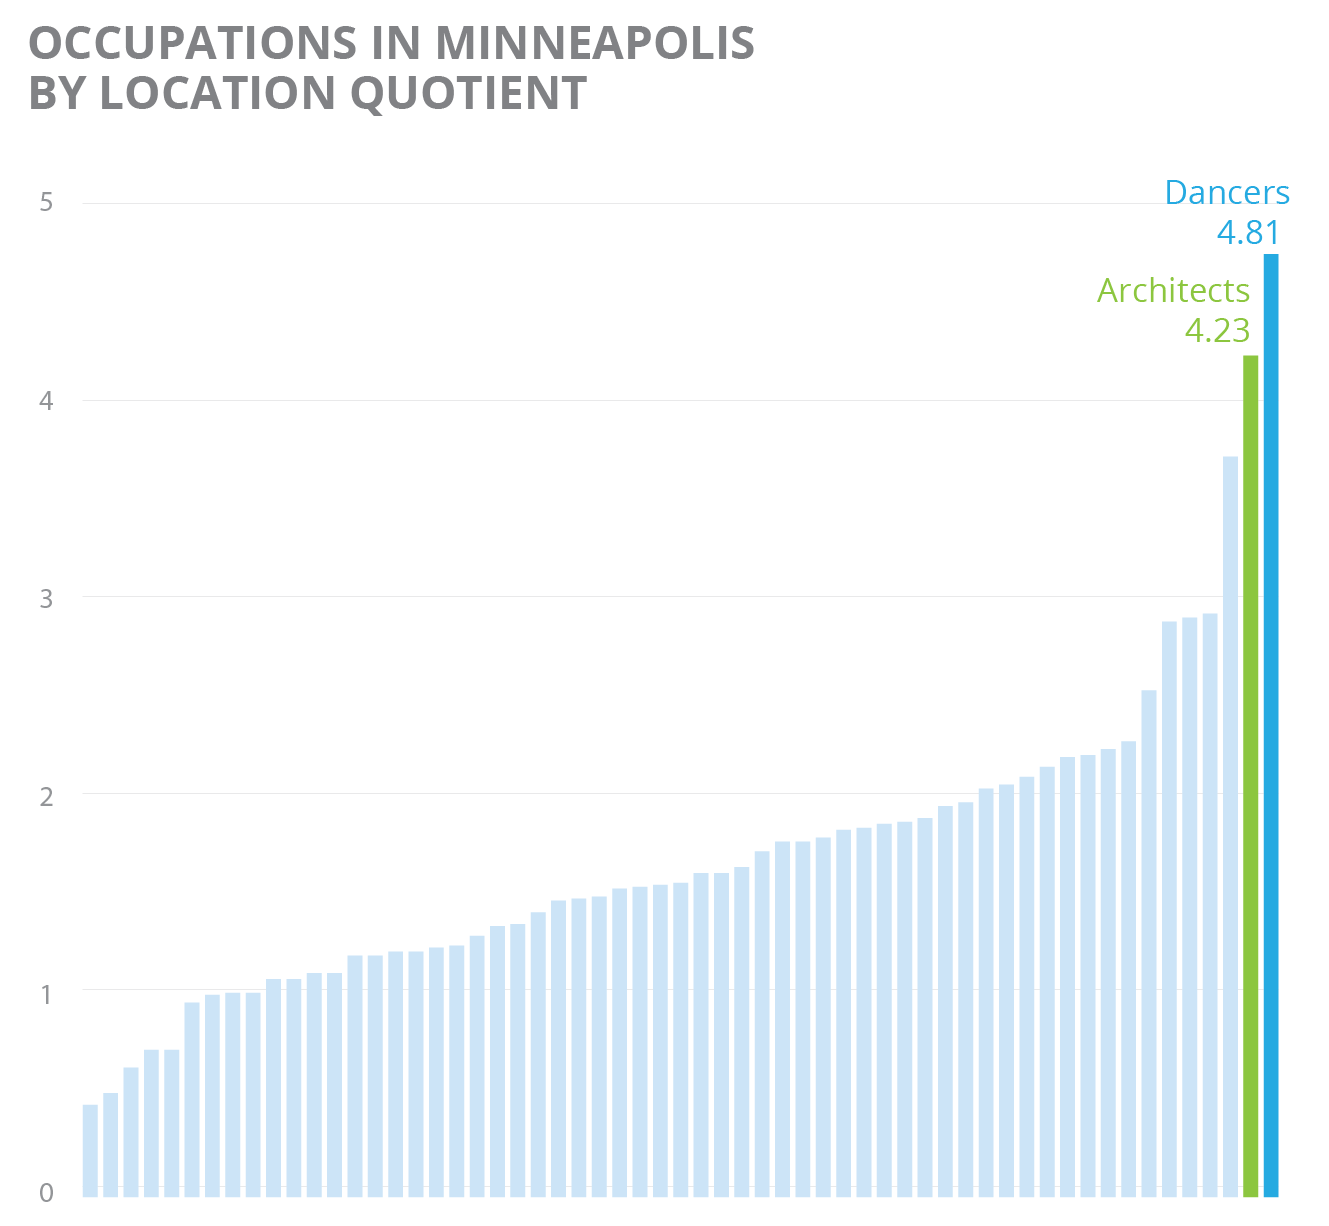
Going back to our example of the concentration of dancers in Minneapolis, let’s take a look at the location quotients of a few concentrated occupations in the creative industry for that specific region. The graph below is a visualization of the density of creative occupations in Minneapolis as compared to the national average. From this report, we can see that the most concentrated creative occupations in that region are dancers and architects with both having an LQ higher than four. This means that dancers and architects are over four times more concentrated in Minneapolis than the national average. This tells us that these are the occupations that help make the Minneapolis creative economy strong.
Look for the release of location quotient data for occupations and industries from CVSuite™ this month. Check out creative economy data from the industry’s leading providers today.
Comments are closed.