REGIONS
SETTING UP ACCOUNT ACCESS
When first signing up with CVSuite, you will select the regions you want in your account and the team will ask you to inform us of the regions you want to include in your subscription. We will then set up the tool to your specified region selections. If you wish to expand or change the regions, please contact the CVSuite team.
GEOGRAPHIES AVAILABLE
There are four distinct region levels available within CVSuite: State, Metropolitan Statistical Area (MSA), County, and ZIP Code. Each region level has specific rules and data associated with them.
STATE LEVEL
State level data can be selected individually or combined with other states to create an aggregate region. For example, you may want to analyze the creative economy in the Pacific Northwest by combining Oregon, Washington, Idaho, Montana, and Wyoming. It is best used for regional analysis or giving context to subregions within a state. state-level data includes occupation, industry, nonprofit, demographic, and CVI data.
State Level Occupation Data Points Include:
- SOC code
- Occupation name
- Start year number of jobs
- End year number of jobs
- Change in jobs from start year to end year
- Percentage change in jobs from start year to end year
- Median hourly earnings
- Average hourly earnings
- National location quotients
- Race/ethnicity
- Gender
- Age
State Level Industry Data Points Include:
- NAICs code
- Industry name
- Industry sales
- Industry job numbers
- Earnings per job, start year
- Earnings per job, end year
- Percentage change of earnings per job
- Total industry earnings
- National location quotients
- Race/ethnicity
- Gender
- Age
State Level Demographic Data Points Include:
- Race/ethnicity
- Gender
- Age
State Level Nonprofit Data Points Include:
Nonprofit data by region
- Region name
- Program revenues
- Contributions and gifts
- Investment income
- Special events revenues
- Total revenues
Nonprofit data by type
- Nonprofit type
- Number of organizations of given type
- Percentage share of nonprofit organizations
- Program revenues for nonprofit type
METROPOLITAN STATISTICAL AREA (MSA) LEVEL
MSA regions within CVSuite are defined by the United States Census Bureau as being “urbanized areas of 50,000 or more inhabitants.” This level is best used for analyzing more urban initiatives or changes. MSA level data includes occupation, industry, nonprofit, demographic, and CVI data
Note: MSA level data can only be selected individually. They cannot be combined with other regions to create an aggregate region. This is due to the inherent properties of their geographic separation.
MSA Level Occupation Data Points Include:
- SOC code
- Occupation name
- Start year number of jobs
- End year number of jobs
- Change in jobs from start year to end year
- Percentage change in jobs from start year to end year
- Median hourly earnings
- Average hourly earnings
- National location quotients
- Race/ethnicity
- Gender
- Age
MSA Level Industry Data Points Include:
- NAICs code
- Industry name
- Industry sales
- Industry job numbers
- Earnings per job, start year
- Earnings per job, end year
- Percent change of earnings per job
- Total industry earnings
- National location quotients
- Race/ethnicity
- Gender
- Age
MSA Level Demographic Data Points Include:
- Race/ethnicity
- Gender
- Age
MSA Level Nonprofit Data Points Include:
Nonprofit data by region
- Region name
- Program revenues
- Contributions and gifts
- Investment Income
- Special events revenues
- Total revenues
Nonprofit data by type
- Nonprofit type
- Number of organizations of given type
- Percentage share of nonprofit organizations
- Program revenues for nonprofit type
COUNTY LEVEL
County level data can be selected individually or combined with other counties to create an aggregate region. For example, you may want to analyze the creative economy in the Denver Front Range region by combining Denver, Arapahoe, and Jefferson counties. It is best for analyzing regions that may have both urban and rural characteristics. County level data includes occupation, industry, nonprofit, demographic, and CVI data.
County Level Occupation Data Points Include:
- SOC code
- Occupation name
- Start year number of jobs
- End year number of jobs
- Change in jobs from start year to end year
- Percentage change in jobs from start year to end year
- Median hourly earnings
- Average hourly earnings
- National location quotients
- Race/ethnicity
- Gender
- Age
County Level Industry Data Points Include:
- NAICs code
- Industry name
- Industry sales
- Industry job numbers
- Earnings per job, start year
- Earnings per job, end year
- Percentage change of earnings per job
- Total industry earnings
- National location quotients
- Race/ethnicity
- Gender
- Age
County Level Demographic Data Points Include:
- Race/ethnicity
- Gender
- Age
County Level Nonprofit Data Points Include:
Nonprofit data by region
- Region name
- Program revenues
- Contributions and gifts
- Investment income
- Special events revenues
- Total revenues
Nonprofit data by type
- Nonprofit type
- Number of organizations of given type
- Percentage share of nonprofit organizations
- Program revenues for nonprofit type
ZIP CODE LEVEL
ZIP Code level data can be selected individually or combined with other ZIP Codes to create an aggregate region. For example, you may want to analyze the creative economy in the city of Pueblo, Colorado by combining 81003, 81004, 81008, 81001, 81007, 81005, and 81006 ZIP Codes. This will give you a more localized perspective of a region. Zip Code level data includes occupation, industry, nonprofit, and CVI data.
ZIP Code Level Occupation Data Points Include:
- SOC code
- Occupation name
- Start year number of jobs
- End year number of jobs
- Change in jobs from start year to end year
- Percentage change in jobs from start year to end year
- Median hourly earnings
- Average hourly earnings
- National location quotients
ZIP Code Level Industry Data Points Include:
- NAICs code
- Industry name
- Industry sales
- Industry job numbers
- Earnings per job, start year
- Earnings per job, end year
- Percent change of earnings per job
- Total industry earnings
- National location quotients
ZIP Code Level Demographic Data Points Include:
- Race/ethnicity
- Gender
- Age
Note: Demographic data are not available for the ZIP Code level separated by industries or occupations.
ZIP Code Level Nonprofit Data Points Include:
Nonprofit data by region
- Region name
- Program revenues
- Contributions and gifts
- Investment income
- Special event revenues
- Total revenues
Nonprofit data by type
- Nonprofit type
- Number of organizations of given type
- Percentage share of nonprofit organizations
- Program revenues for nonprofit type
ZIP Codes are postal codes used by the US Postal Service (USPS) to deliver mail. Although the majority of ZIP Codes do not change, the USPS can reallocate, add, or remove ZIP Codes to efficiently plan better delivery routes for quicker mail delivery. Periodically throughout the year, CVSuite will sync our ZIP Codes with the latest ZIP Codes from the USPS and EMSI. Some users may have ZIP Codes as part of their permissions and existing regions that are no longer supported by the USPS. When CVSuite updates our ZIP Code region, we will automatically remove the unsupported and invalid ZIP Codes from your account and notify you which ZIP Codes were removed.
HOW TO COMBINE GEOGRAPHIES
In CVSuite you can combine geographies into an aggregate region. This can be done only for similar region levels can be combined. (i.e. States combine with States, Counties with Counties, and ZIP Codes with ZIP Codes.) Visit New to CVSuite if you need more information on how to create a region of analysis.
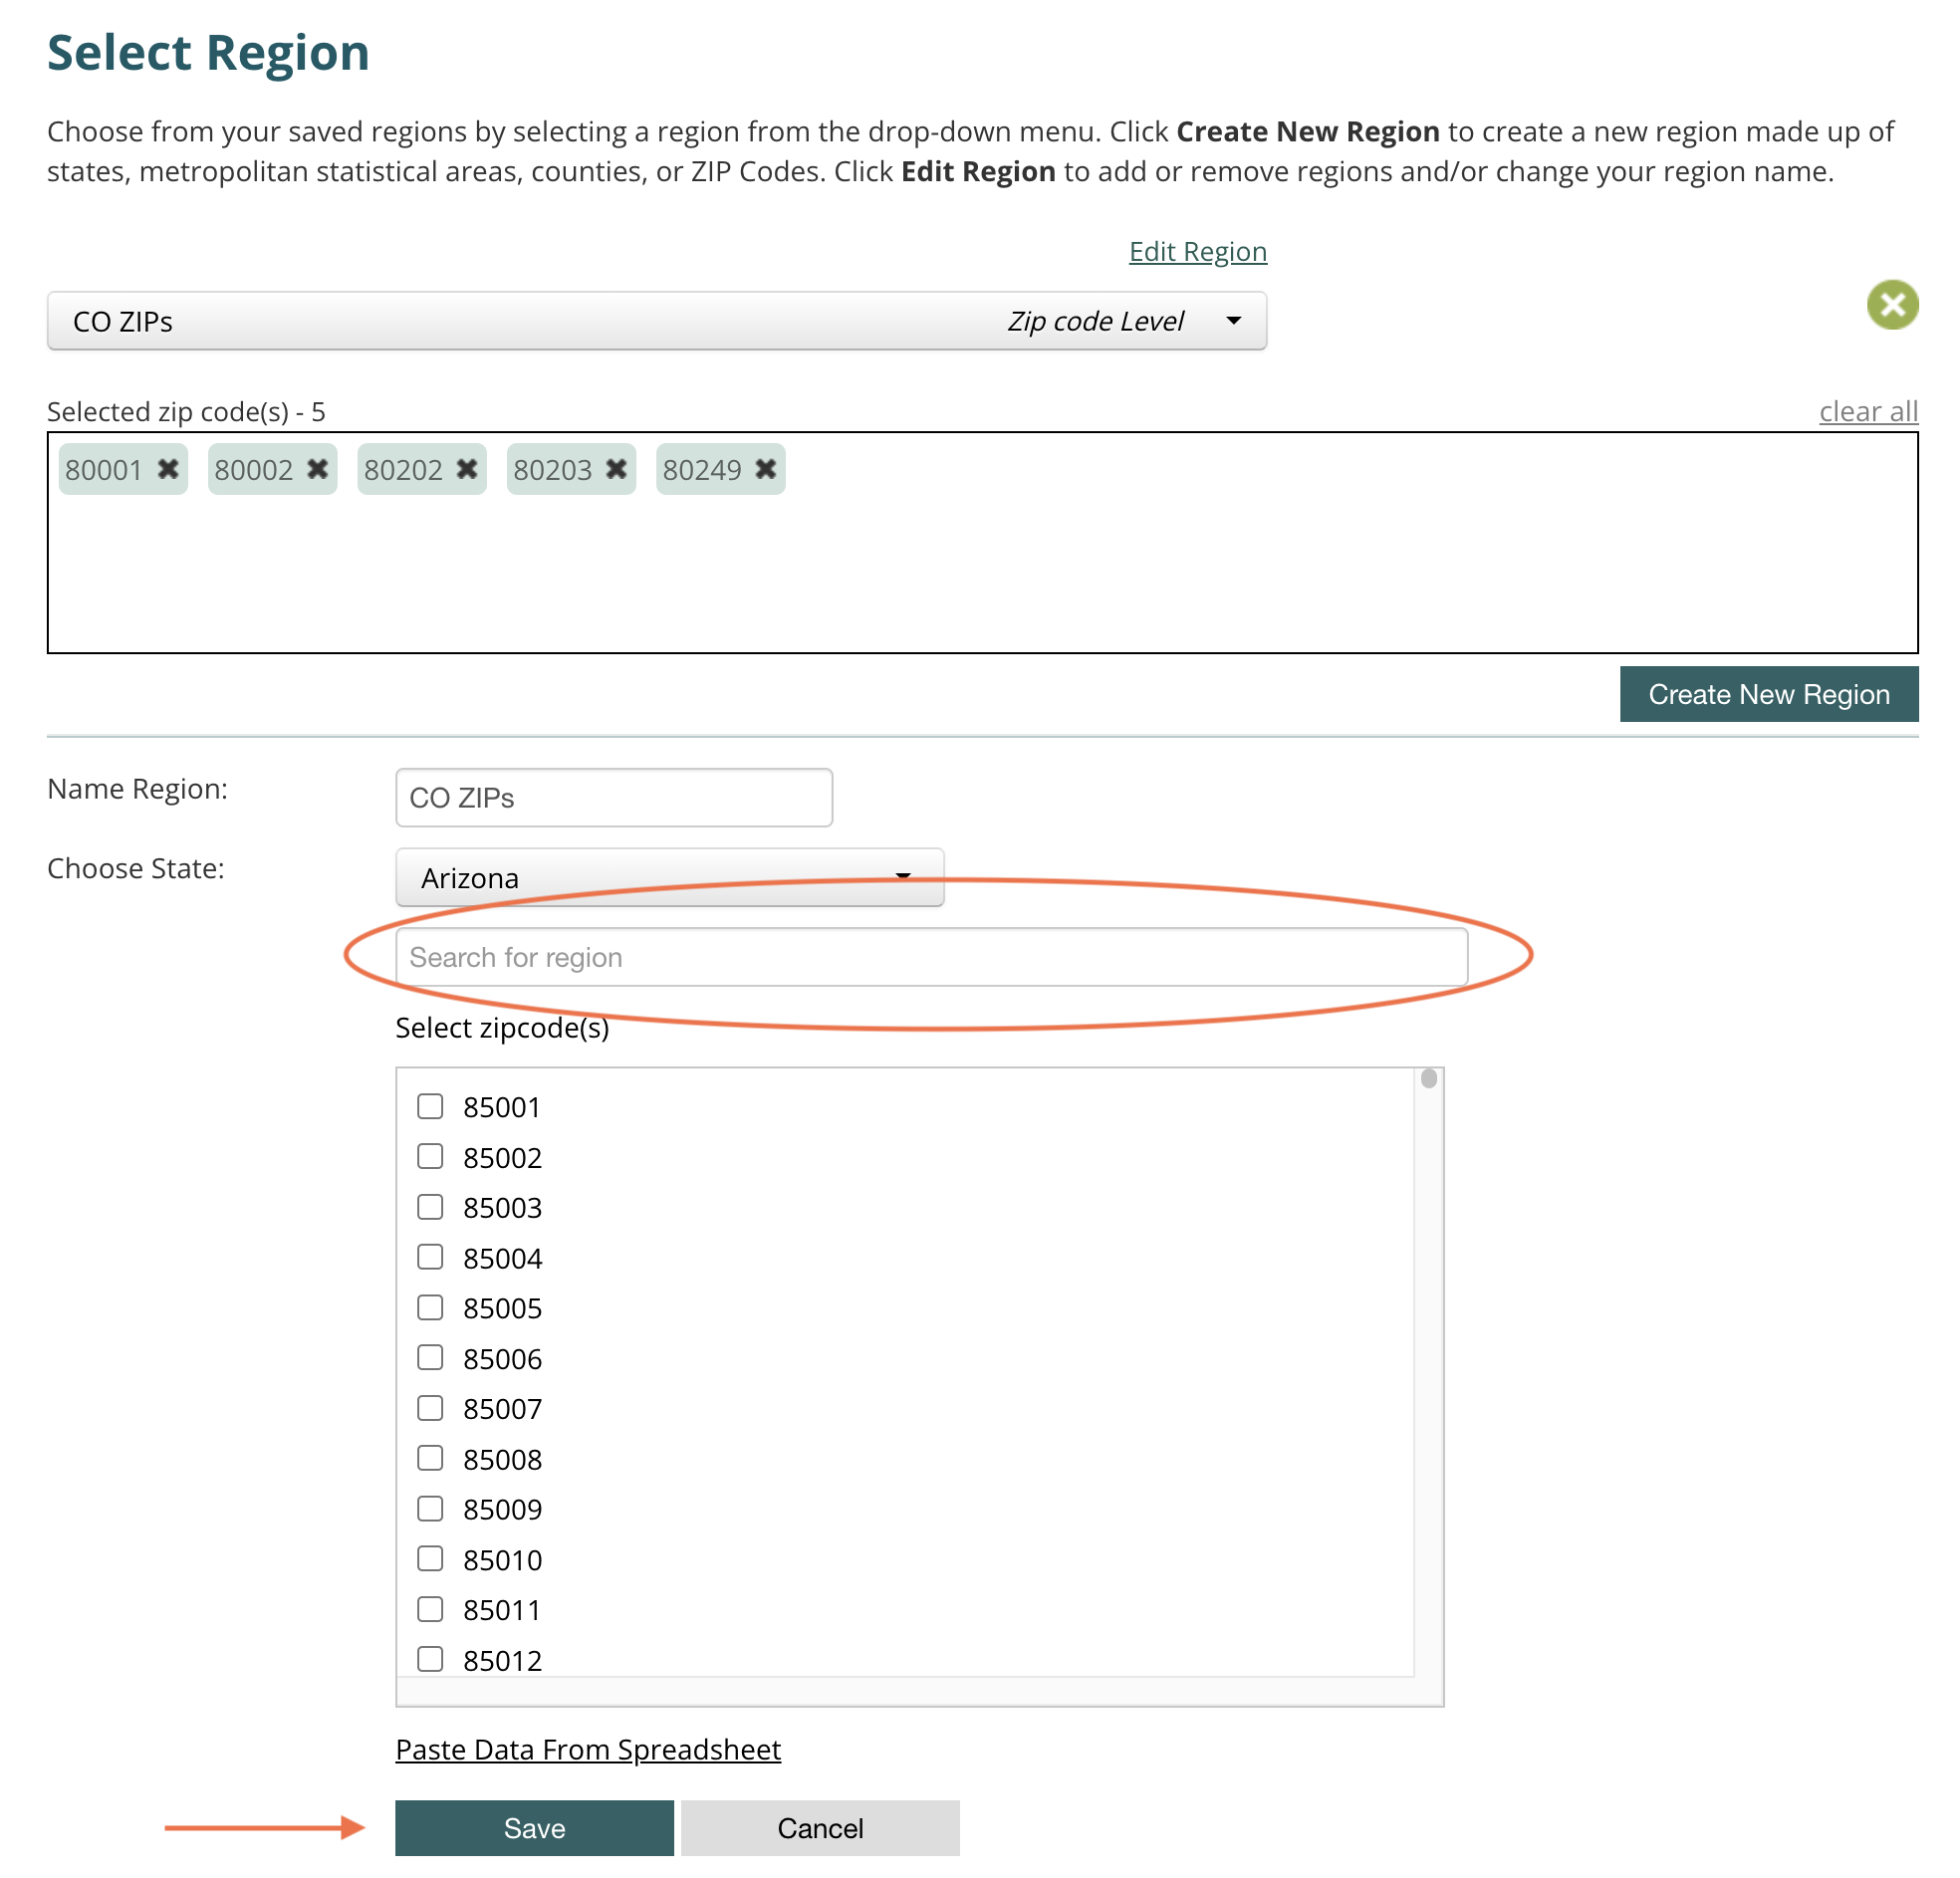
- To combine regions you can either manually scroll or search for the region.
- Click the checkbox next to the desired geographies.
- After selecting all desired geographies, click Save.
Note: Only geographies shown in the Selected box will be included in your region of analysis.