
Are you having trouble analyzing your creative economy data or don’t know what to do with the data once you have them? Below are some tips to consider when analyzing your creative economy data.
DEFINE YOUR GOAL
First, ask yourself what you are trying to achieve with your data. Your goals should be S.M.A.R.T (specific, measurable, attainable, realistic, and timely).
COLLECT THE DATA
Once you have defined your goal and start collecting the data, ask yourself the following questions:
What data do you need to measure for the success of your goal?
Before diving into the data, consider creating a list of ideal metrics that will help answer the key questions you want to address.
What data are available?
Not all of the data on your “ideal list” will be available. That’s okay, but now is the time to consider redefining your goals. Don’t forget: Analysis is a fluid process. Be patient.
In what form are the data available?
Sometimes data aren’t available in the form you expect them to be. Data can be found in many different forms. If the data are not represented in a form that’s useful for you, consider converting them into a form that will be.
GET ORGANIZED
Try organizing your data in a way that makes sense to you. Let’s face it, numbers can be scary and overwhelming for a lot of us, so why not simplify your process? Utilizing outside tools such as Excel, Google Sheets, or even data visualization tools like Tableau or Venngage could be useful in analyzing the data visually as opposed to presenting your data in spreadsheets.
ANALYZE THE DATA
Analyzing data can be challenging, but there are ways to make it more manageable. Take into account some key components, such as data correlations, trends, and variations within the numbers.
Correlations-the process of establishing a relationship or connection between two or more variables. Positive and negative correlations between variables can both be informative, but remember that correlations aren’t causations. Correlations are a statistical measure that indicates the extent to which two or more variables fluctuate together. A causation indicates a relationship between two events where one event is affected by the other.
Trends-A pattern of gradual change in a condition, output, or process, or an average or general tendency of a series of data points to move in a certain direction over time.
Variations-a change or difference in condition, amount, or level—typically with certain limits.
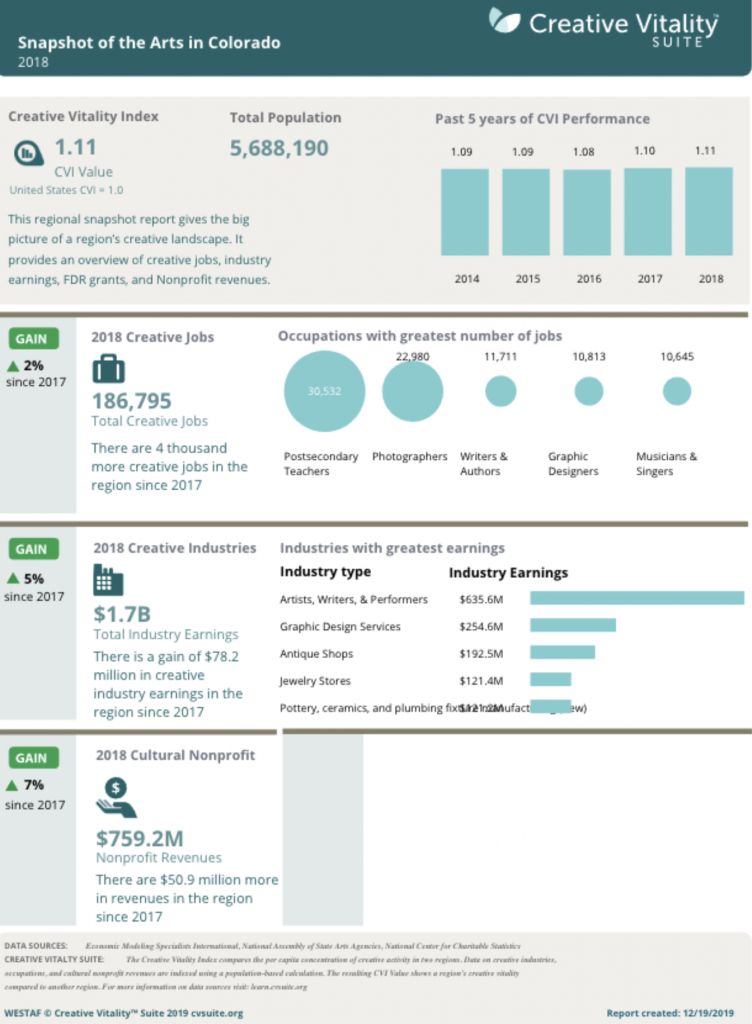
SNAPSHOT REPORTS
Utilizing CVSuite’s Snapshot Report is another easy way to analyze your data. The Snapshot Report allows CVSuite users to pull key data points into a single, easy-to-read report. The report presents percentage changes in creative jobs, creative industries, and nonprofit revenues that will help you track correlations, trends, and variations throughout the years. The CVSuite Snapshot Report also compares the current year to the immediate past year.
CVSuite is Here for You
If you are in the midst of a report, special project, or just getting started with analyzing data, we are here to help. CVSuite Data Analyst Trevor McElhaney is happy to assist with any questions you may have on data analysis or how to get started. Contact us at cvsuite@westaf.org—and don’t forget to follow us on social media for tips and tricks on analyzing creative economy data.
Happy analyzing!
Comments are closed.