
CVSuite offers data for every state, metropolitan statistical area (MSA), county, and ZIP Code in the United States so you can investigate and compare any region.
Essential Features for Analyzing the Creative Economy
Creative Vitality Suite is an online creative sector data tool. The data is used to document, advocate, and further the economic impact of the creative sector at the regional, state, and local levels.
Define the region of analysis

Share reports and visualizations
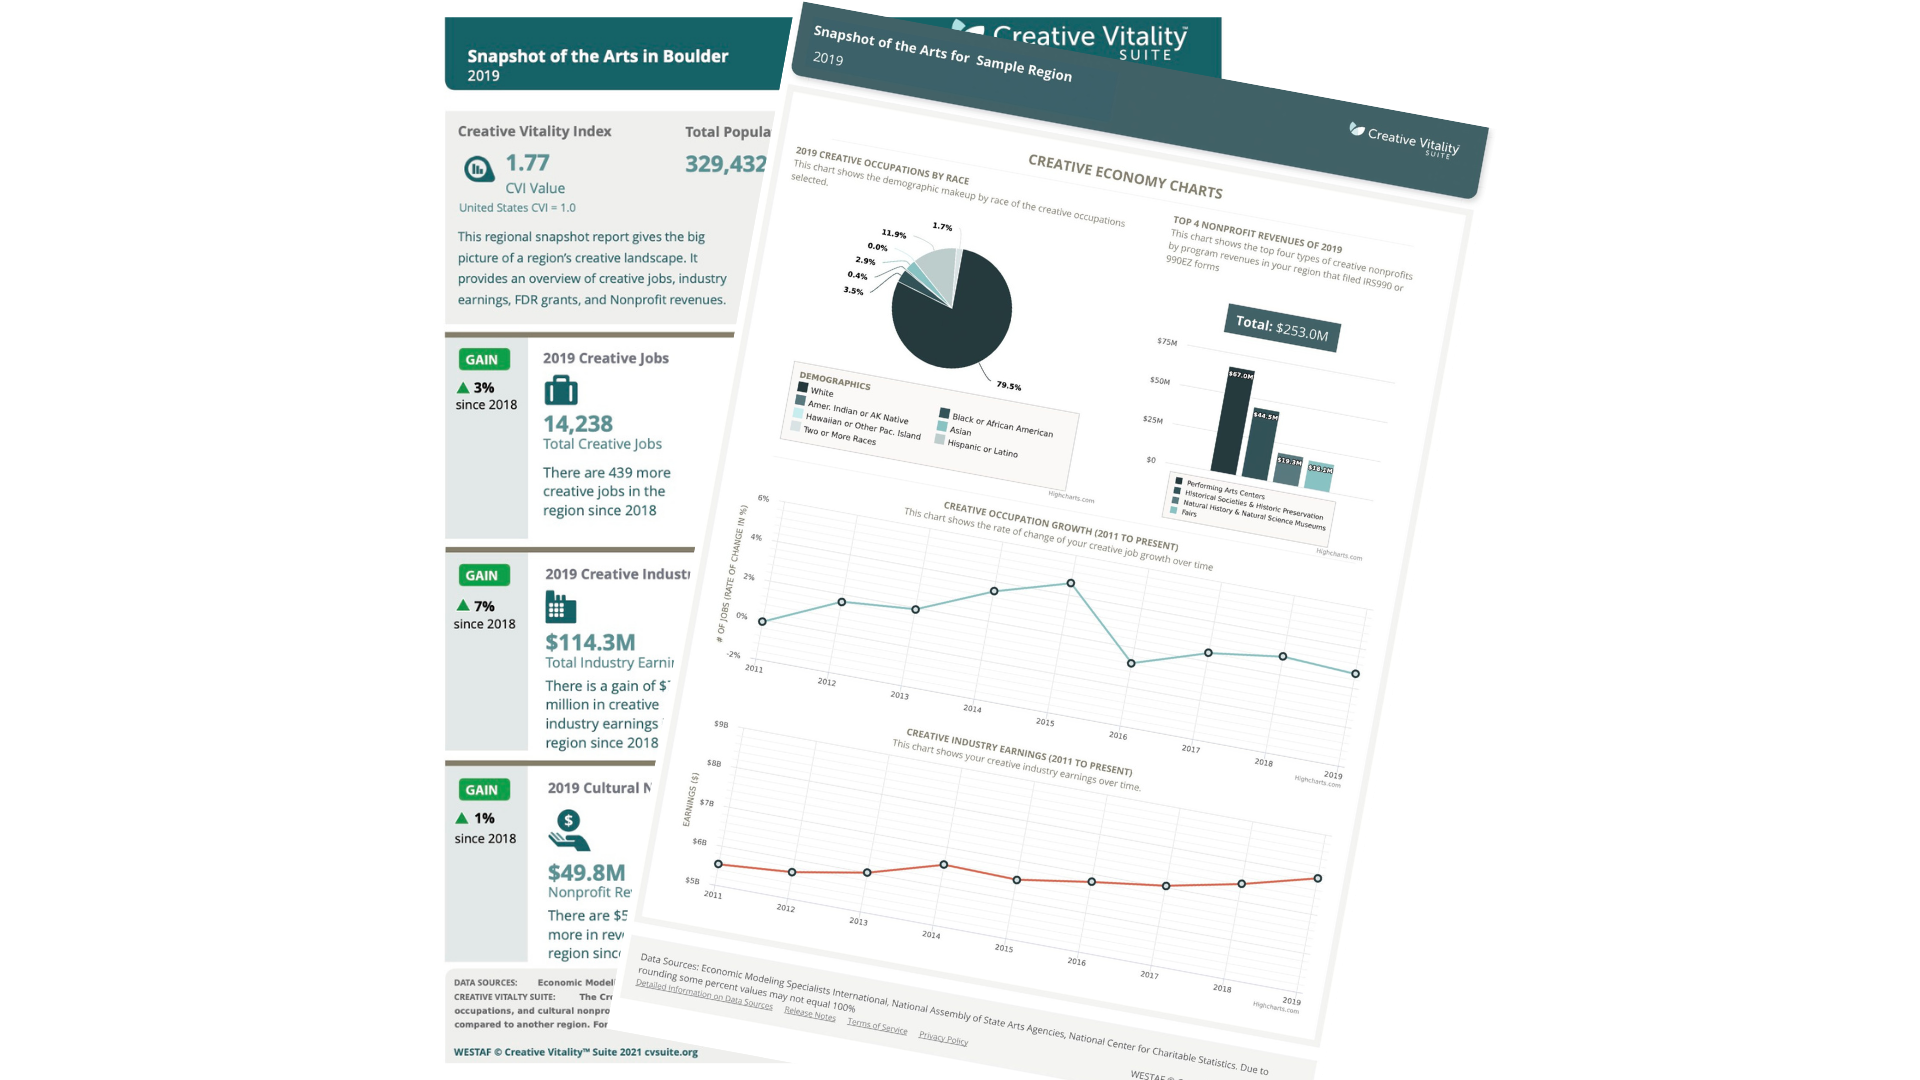
CVSuite offers multiple reports and visualizations that provide an overview of the creative economy activity in your region including information on creative occupation jobs, demographic details, and arts-nonprofit revenue. Download and share with your staff, board, and legislators.
Present the most current annual trends
CVSuite has the most current creative economy data so you can analyze annual trends starting with data from 2011 to the most current year. New data years are added every fall.

Benchmark with the Creative Vitality™ Index (CVI™)
Using the Creative Vitality Index, you can compare the concentration of creative economy in your region to the U.S. average and other comparison regions. The CVI combines core creative occupations, creative industry sales, and arts-nonprofit revenues into a simple index value.

Select your creative economy codes
Analyze specific creative sectors using code selection. CVSuite contains 96 industry codes and 88 occupation codes, allowing you to define the creative economy to meet your needs. Create, save, and toggle between creative economy definitions.

Reliable and trusted data sources
CVSuite partners with Lightcast, which cleans and validates national economic data from over 80 different sources. The national data include the Bureau of Labor Statistics (BLS), the Bureau of Economic Analysis (BEA), and the Internal Revenue Service (IRS).


Measure inclusion and diversity in the workforce
With demographic data, gain insights on inclusivity, equity, and age distribution in the creative workforce.

Examine different employment types
Jobs can be grouped by salaried employment (full-time and part-time jobs) as well as the self-employed and extended proprietors (workers who report secondary income).