The CVSuite™ team is bringing back Data Dives, a series of blog posts that explores the different ways to use the Creative Vitality Suite tool and its data. CVSuite offers a wide array of creative economy data that can help you tell your data-driven story. This month, we dive deeper into our newly vetted 2020 data to explore Alaska’s creative economy by identifying trends within the job market, examining thriving industries, highlighting demographics, and more!
Where do I start now that I have access to CVSuite?
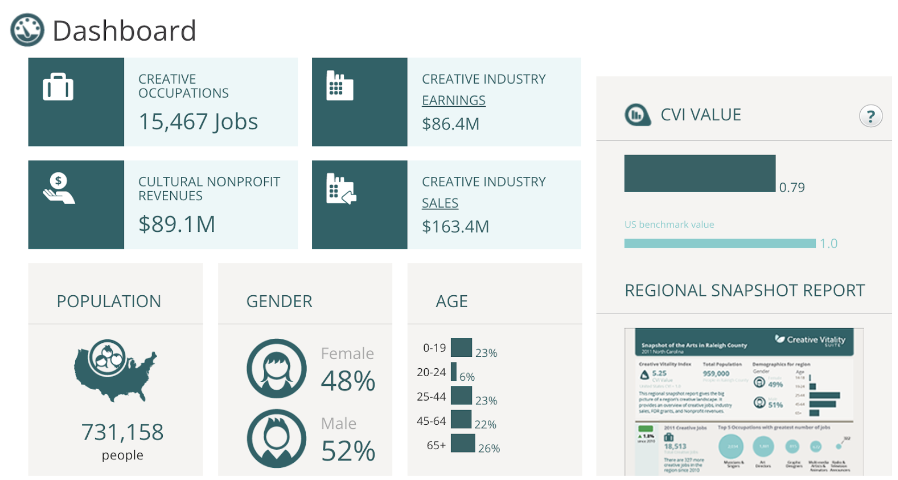
Once you log in to the tool, you will see the dashboard, your at-a-glance view of your region’s creative occupations, industry earnings, nonprofit revenues, sales, and more! Here we can easily see that Alaska has a population of 731,158, with 48% being female and 52% being male. We can also identify that there are 15,467 creative occupations, $89.1 million in nonprofit revenues, $163.4 million in creative industry sales, and a total of $86.4 million in creative industry earnings. Utilizing the dashboard is a great way to capture big picture data if your special project does not require deep analysis.
Is there a correct creative economy definition?
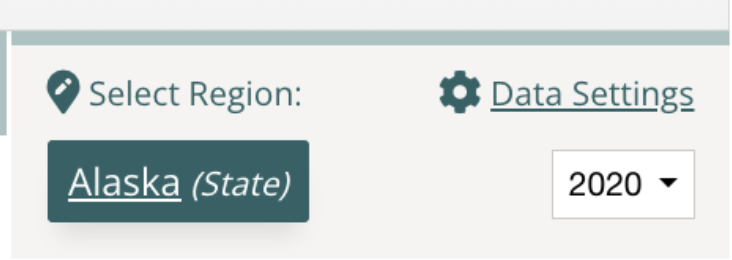
There is not a universally accepted definition of the creative economy, but there are many different world views and considerations that help inform how people set those definitions. The CVSuite tool takes a broad approach to the meaning of creative. Instead of defining what codes are creative, the tool leaves this up to the user to decide. CVSuite users can choose from a variety of 98 industry (NAICs) codes and 85 occupation (SOC) codes to create a comprehensive definition of the creative economy, or they can select specific codes for a focused industry sector analysis. To begin your data analysis, go to the Data Settings link at the top right-hand corner of the dashboard and select your codes:
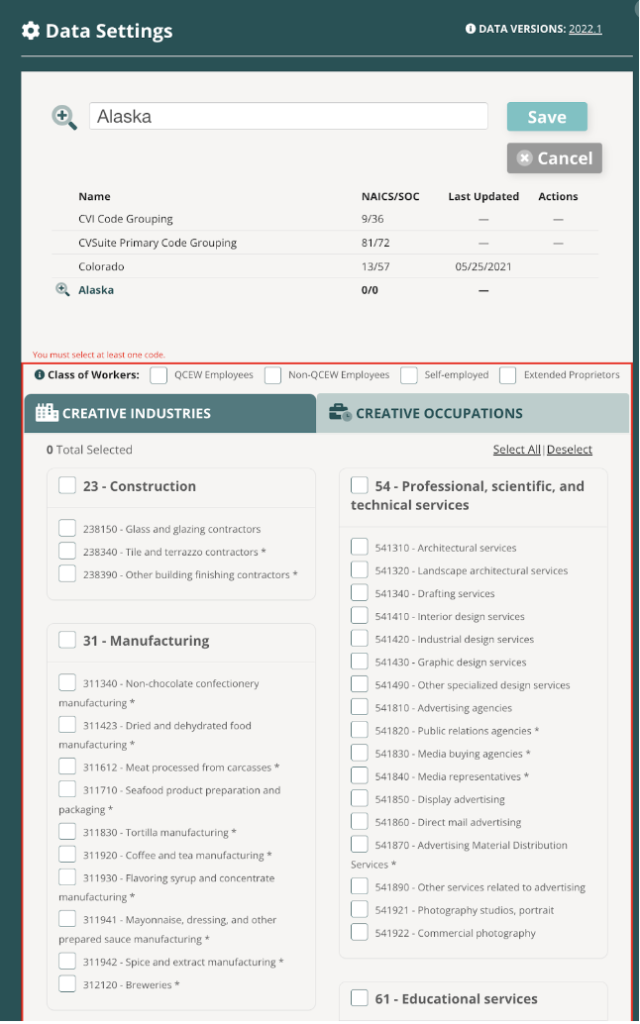
Once you have selected your codes, the dashboard will update with new values that reflect the codes you’ve selected.
What is the Creative Vitality™ Index and how is it calculated?
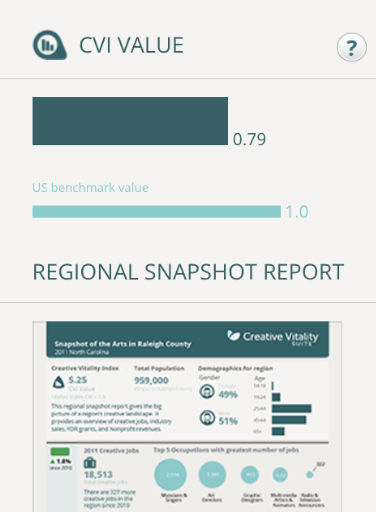
The Creative Vitality Index (CVI™) is an index that approximates the region’s creative economic health by calculating the creative occupations, industry sales, and nonprofit revenues of the region. The CVI Value in CVSuite is set by default to show the creative vitality of the region selected compared to the U.S overall. This default value can be found on the upper right-hand side of the dashboard and within the Snapshot Report.
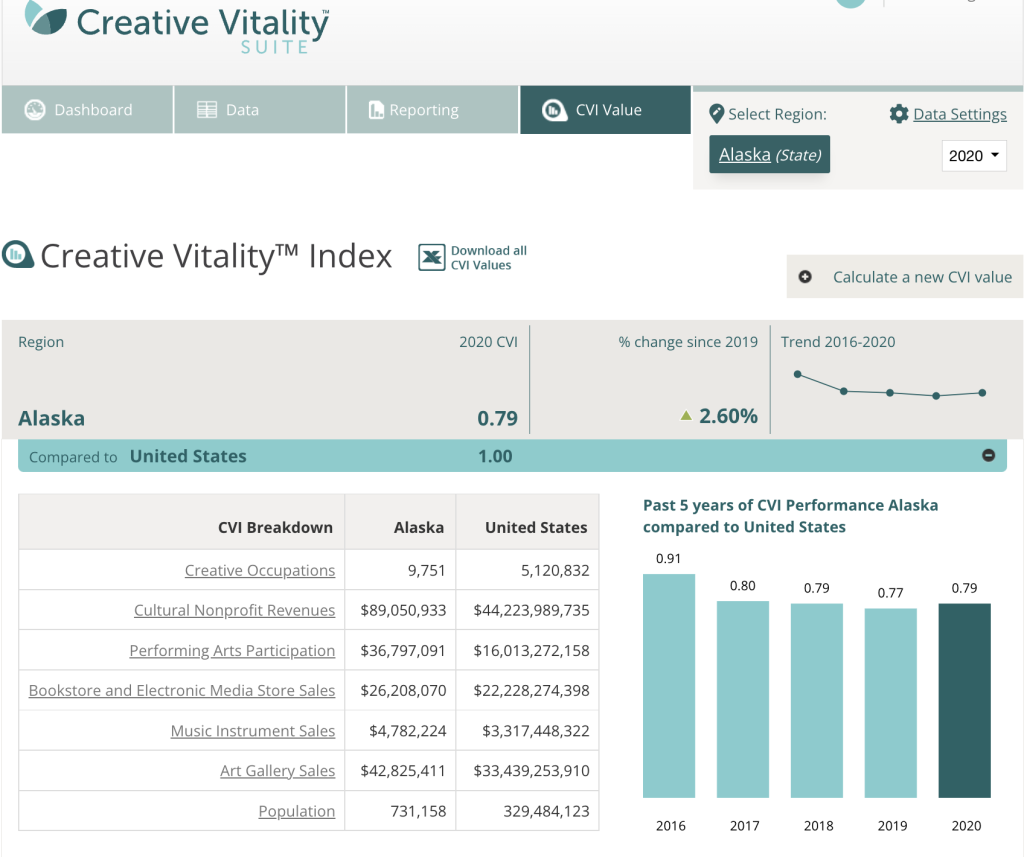
Alaska’s CVI is 0.79, compared to the national average of 1. Looking at the CVI breakdown (creative occupations, cultural nonprofit revenues, performing arts participation, bookstore and electronic media store sales, music instrument sales, art gallery sales, and the total population) will show you how those values contribute to forming the CVI. Having access to the CVI breakdown will help you identify trends and better understand what creative markets are making the most impact in the region. From this data, we can see how Alaska’s CVI has steadily decreased over the past five years.
Where can I view the breakdown of the data?
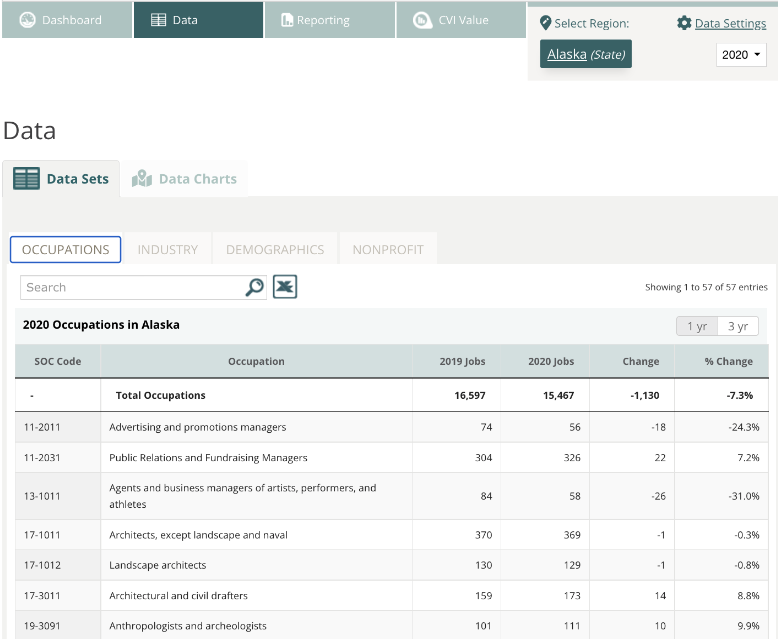
To access more in-depth data, go back to the dashboard and click on the Data tab, which will provide you with a plethora of occupation, industry, demographic, and nonprofit data sets that will further inform your analysis. This page allows the user to toggle between the four different tabs and explore how the data has shifted throughout the years.

Occupation Data
This specific occupational data set shows that from 2019 to 2020, Alaska’s job market decreased by 1,130. To identify occupational data trends and form inferences about this data, CVSuite users can switch from a one-year comparison to a three-year comparison. You can use our industry, demographics, and nonprofit tabs in a similar fashion.
Industry Data
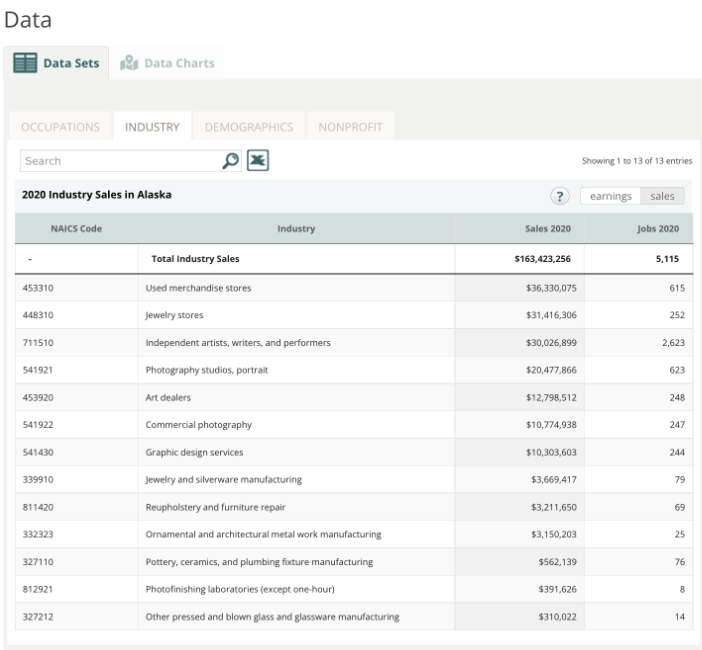
If you click on the Industry tab, you will see a similar breakdown of the industries thriving in Alaska. In 2020, used merchandise and jewelry stores, independent artists, photography studios, and art dealers were the top five leading industries driving Alaska’s creative economy.
Demographic Data
You’re probably wondering who and what make up the state of Alaska? Look no further—if you click on the demographics tab, you will see the option to view the demographic data by race/ethnicity, gender, or age.
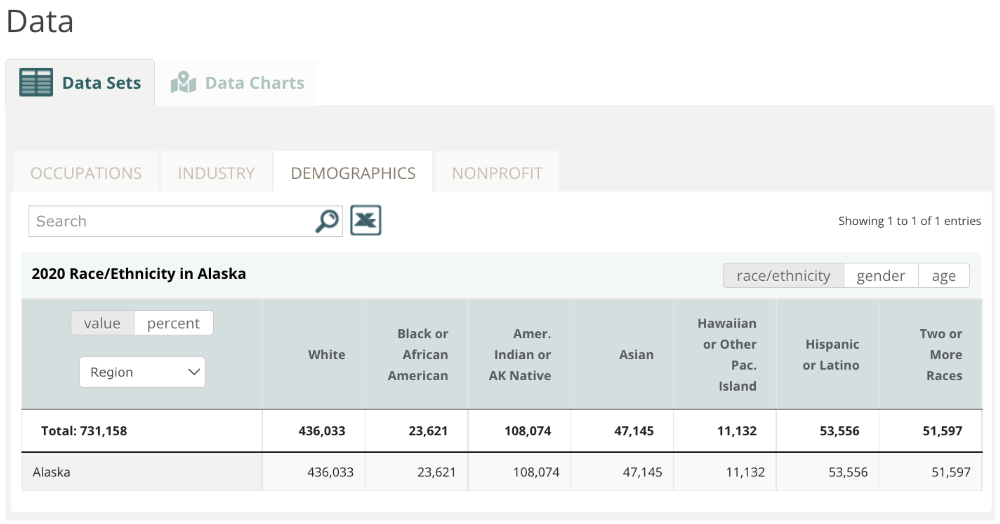
CVSuite’s demographic data can help users identify the most diverse creative industries and occupations, find areas within the creative workforce that can improve, compare peer regions, and create data visualizations. Alaska’s demographic makeup consists of White and American Indian or AK Native, followed by Hispanic or Latino, two or more races, Asian, Black or African American, and Hawaiian or Pacific Islander. For an even more focused look at demographic data in an area, users can view data from a gender or age perspective by clicking the respective tabs at the top right of the page.
Nonprofit Data
The nonprofit data includes funds generated through the region’s primary operations. It may consist of amounts collected through contributions, fundraising, membership, and service fees. This information helps determine how your organization and its services are making an impact across the field.
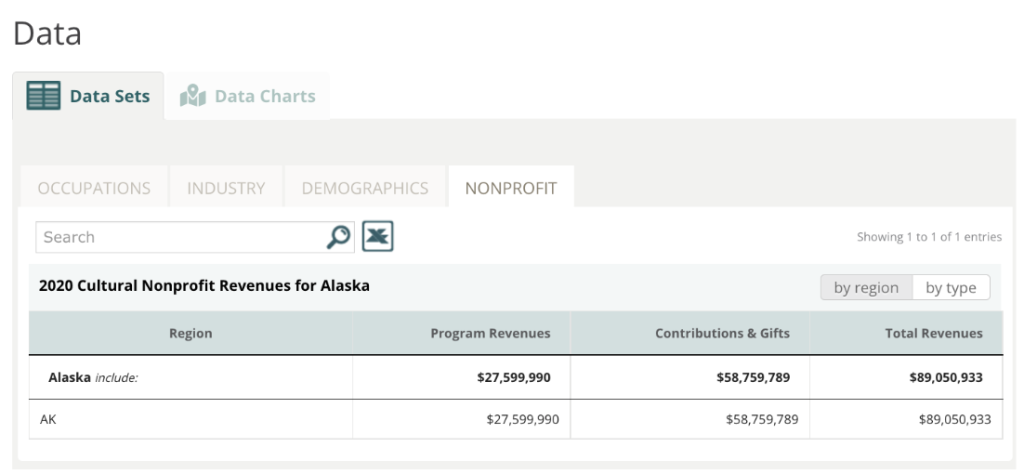
We can see that Alaska’s nonprofit organizations contribute $89,050,933 in revenues. Is this a strong contribution, you might ask? This depends largely on the organization’s year-end goals. Users can evaluate, make strategic decisions, highlight impact, and utilize this data in deciding how to move forward. Nonprofit data is key to advocating for more funding!
How can I present my data in a fun and engaging way?
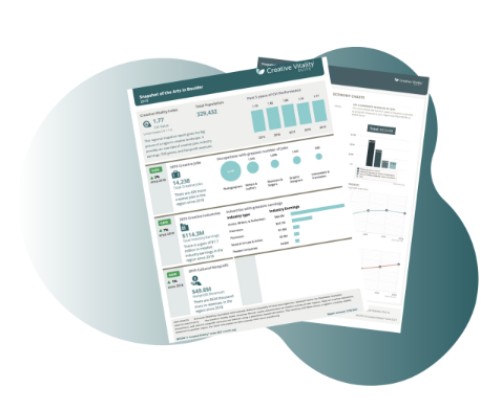
We’ve done the work for you! Depending on your analysis, CVSuite offers a variety of customizable reports to present your data in an effective and visually appealing way. Data visualizations are essential to data storytelling—let’s face it, creative economy data should be compelling, impactful, and fun!
- Snapshot Report
This report covers the data on the region’s CVI value, creative occupation jobs, creative industry earnings or sales, and nonprofit revenue.
- Data Charts
The downloadable data charts allow users to easily analyze and interpret data at a glance. The charts include the racial makeup of your region’s creative occupations, top arts and culture nonprofit program revenues by type, the growth rate of your creative occupations, and creative industries’ earnings.
In addition, tools like Canva, Datawrapper, Tableau, and programs such as Google Sheets* offer various graphs and charts to display your data and help you tailor your message to your audience.

Stay Connected
Was this content helpful? Subscribe to our CVSuite newsletter and follow us on social media to receive updates when a new blog is released and to stay in the loop on what’s happening in the creative economy sphere. If you have any questions or are interested in using CVSuite for your data needs, contact the CVSuite team.
*Any links to other third-party websites of nonaffiliated external sources does not imply endorsement by WESTAF of any products, services, or information presented in these external websites, nor does WESTAF guarantee the accuracy of the information contained on them. In addition, since WESTAF has no control over the privacy practices of third-party websites, you should read and understand the policies of all linked external websites with respect to their privacy practices. See WESTAF’s Privacy Policy, located at http://www.westaf.org/privacy/.

Comments are closed.