
In August 2015, the CVSuite™ will begin to highlight Industry Earnings data rather than Industry Sales data. Although Industry Sales data will remain available on the site, Industry Earnings data will provide CVSuite™ users with a more comprehensive measure of economic impact in a defined geographic area.
In order to help users of CVSuite™ data better understand the decision to change the emphasis from Industry Sales data to Industry Earnings data, we are providing expanded information about these two types of data.
Industry Data: What is the difference between Earnings and Sales?
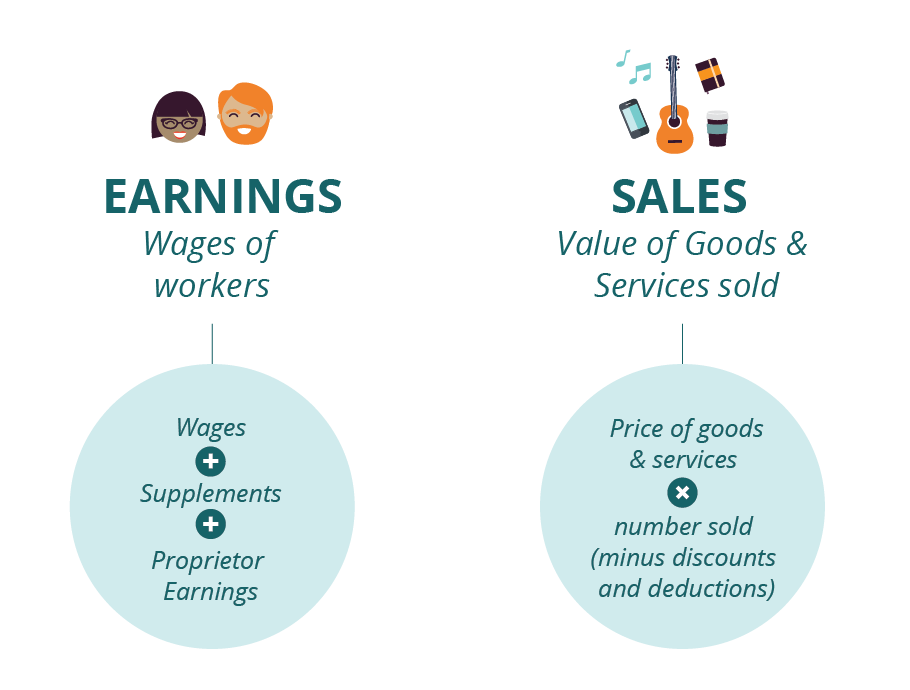 Industry Sales data and Industry Earnings data measure two different types of impact on the creative economy. Industry Sales data, which is often referred to as Industry Revenue, is arrived at by multiplying the price at which goods or services are sold by the number of units sold. Industry Sales data represents the estimated amount of money that companies in a given industry receive during a specific period. This estimate is adjusted for discounts and deductions for returned merchandise. Industry Earnings data is arrived at by aggregating the compensation paid for the labor of all workers in a given industry. The compensation comes from three areas:
- Wages and salaries paid to all workers in a given industry.
- Supplements to wages and salaries such as employer contributions to employee pension and insurance funds.
- Proprietor earnings.
The data is reported as average earnings per job¹. In some public data sources, such as Bureau of Labor Statistics’ SPI/LPI and QCEW, Industry Earnings are called “wages.”
The Reason for the Change
Industry Sales tend to appear as larger than Industry Earnings. However, Industry Sales are not always the best indicator of the actual impact an industry has on a regional creative economy. Even if the revenue generated by industry sales is sizable and growing, unless the capital is reinvested in the regional creative economy, its overall impact could be more of mirage than a reality.
An Art Industry Specific Example
To illustrate why this is the case, we provide the following example of how Industry Sales data and Industry Earnings data would capture the impact of two creative companies differently. As examples we are using a small graphic design firm and a performing arts venue. Both the design firm and the performing arts venue generate $100,000 in sales, which to some would make their overall impact appear to be identical. However, by looking at earnings data, important differences emerge.
Design Firm If one assumes that the design firm hires from the local talent pool, a likely scenario would be that $70,000 of the funds received through sales remain in the county in the form of art directors’ and designers’ wages and salaries. These employees then use their earnings to purchase local goods and services. Perhaps $30,000 of design firms’ sales revenue leaves the county to pay for supplies and services not available in whole or in part locally.
Performing Arts Venue By contrast, at the performing arts venue, perhaps only $20,000 remains in county in the form of wages for a local ticketing agent, a lighting specialist, and a curator. $60,000 of the revenue received by the venue is allocated for fees associated with hiring high profile, out-of town performers, with this money leaving the county. An additional $20,000 that is expended by the performing arts center also leaks out of the local economy for the purchase of goods and services not available locally.
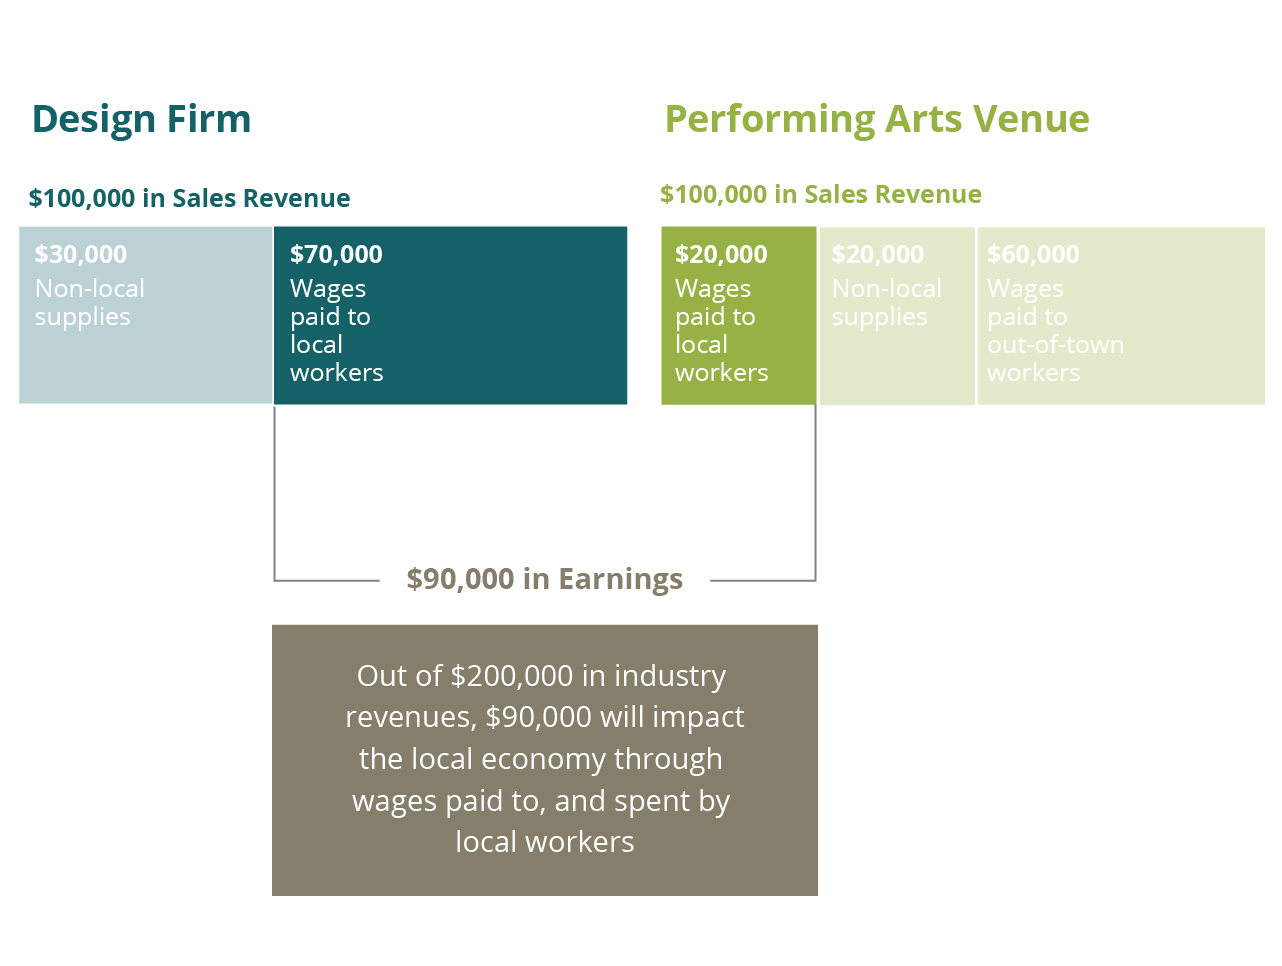
As you can see from this example in the diagram above, in terms of sales both ventures have the same aggregate “impact;” however, when viewed in terms of earnings, it becomes clear that the performing art center has only one-fourth the local impact of the design firm. Put simply, if a large percentage of sales revenues leak out of a local economy, they cannot be counted as direct impacts attributable to a given industry. Sales may be bringing money into a regional creative economy, but unless that money starts rippling through the local economy, it is unlikely to spur sustained and concentrated growth. The allocation of the sales dollars to employees and proprietors in the form of earnings sets the rippling process into motion.
Arts and cultural organizations need to stay highly attuned to how various industries directly contribute to their local creative ecosystem. Developing competency about the nuances of using key data metrics like Industry Sales vs. Industry Earnings to measure impact will enable such organization to gain a better understanding of the creative economic spaces in which they operate.
¹Amounts are reported as average earnings per job for the most recent year of data only. If the most recent year of data is not the current year, then earnings are “brought forward” into the current year using the most recent job/earnings ratio combined with EMSI’s current-year jobs estimate.
For reference: Investopedia Definition of Revenue EMSIs blog post – Sales Multiplier Example: The difference between earnings and sales EMSIs blog post – The Rights and Wrongs of Economic Impact Analysis for Colleges and Universities
Comments are closed.