As creative economies continue to grow across the globe, many cities and states are realizing the value of dedicating time to researching and evaluating the health of their own creative economies and comparing them to cities of similar sizes and demographics. Data produced by platforms like CVSuite enable cities and states to regularly measure the size, growth, profile, health, and overall impact of their respective creative sectors. California, Minneapolis, and Houston are among the latest to publish insights into their creative economies.
As stated in the 2015 Otis Report on the Creative Economy of California, the researching and publishing of creative economy data are usually done for a very specific goal: “To encourage further investment in arts education, economic development, and cultural planning” (Otis Report, 2015, p. 9).
As the country’s sixth strongest creative economy, the city of Minneapolis has been producing annual Creative Index reports since 2013. In its latest report, The Minneapolis Creative Index 2015, the city uses ZIP Codes to measure the city’s creative employment and to enable researchers to map out the spread of creative fields and activities across the city. The city of Houston published its first creative economy report in 2012. The city’s latest report, The Creative Economy of Houston, studies locally sourced staff, jobs, and products, and compares Houston’s creative economy to that of five other cities of a similar size. With a population of more than two million and a ten-county regional population of approximately 6.1 million people, Houston is the fourth largest city in the United States and the country’s fifth largest metropolitan region.
Unlike the Minneapolis and Houston reports, the 2015 Otis Report on the Creative Economy of California covers a period of five years: 2009-2014. With start-ups, technology companies, and a renowned film industry, it is no surprise that California is a thriving creative hub. The Otis Report states that there is little doubt that creativity is “one of California’s foremost economic assets” (Otis Report, 2015, p. 20). The California report provides snapshots of eight regions: Bay Area, Capital Region, Central Coast, Inland Empire, Central Valley, San Diego-Imperial Valley, Los Angeles-Orange County, and Upstate California.
All three reports highlight the health of the creative economy, employment, and salaries of the creative sector and provide tangible comparisons.
Tangible Comparisons
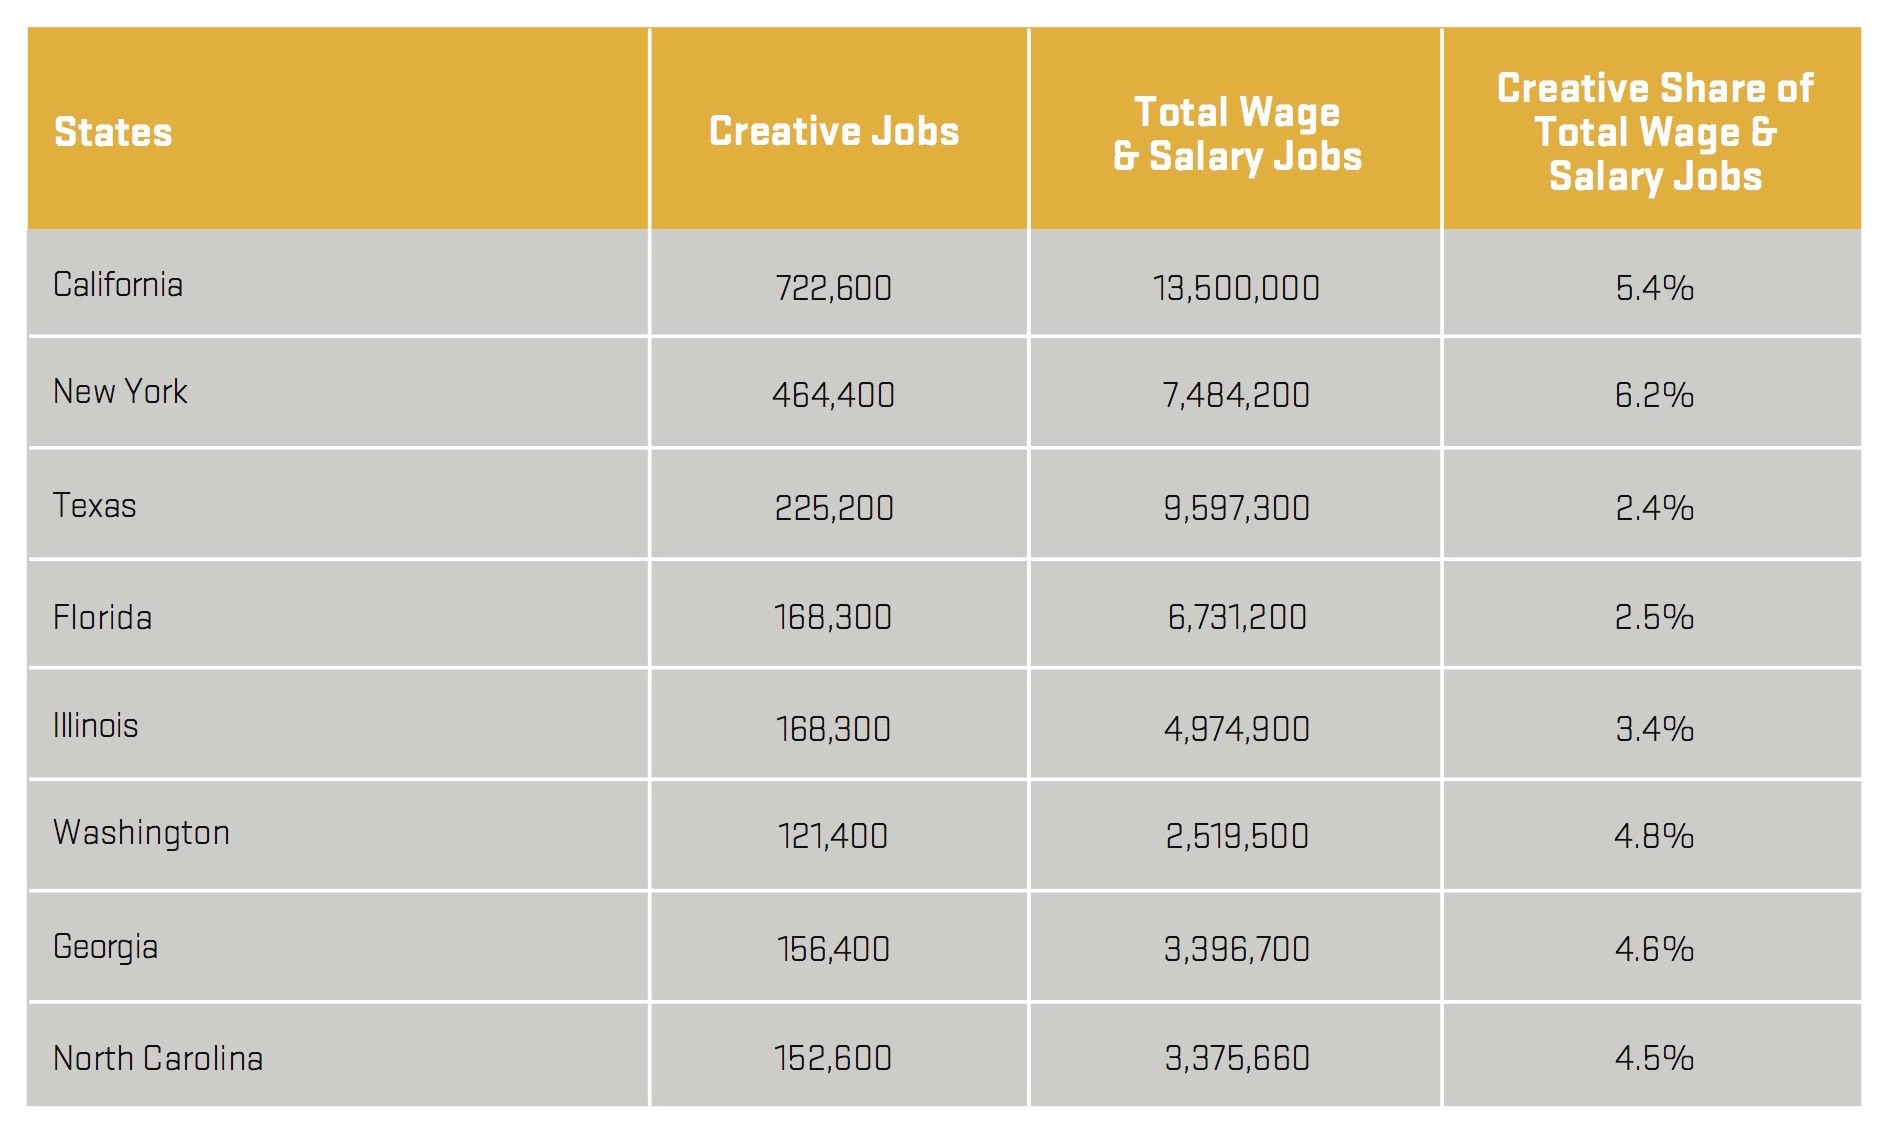
Each time a report is published, the authors are keen to make bold claims as to why and how the creative industries in a particular area are thriving. As Gülgün Kayim, Director of Arts, Culture and Creative Economy for the City of Minneapolis states in a recent interview with the CVSuite team, the published data have to point to something tangible that readers can grasp and to which they can relate. The $4.5 billion that creative industries contributed to Minneapolis’s local economy in 2015, for example, was eight times more than the amount generated by the city’s sports industry. In Houston, the creative economy employs more people than the Texas Medical Center. The California report highlights that, with 722,600 wage and salary workers in the state’s creative industries, California has the largest number of creative workers of any state (see table below). By comparison, New York State is a distant second with 464,000 creative jobs, followed by Texas with 225,000 creative jobs.

Table pulled from the 2015 Otis Report on the Creative Economy of California.Health of the Creative Economy
Data in the Minneapolis report highlight that creative industries experienced over $4.5 billion in sales in 2014, with sales from creative industries accounting for 5.5% of all industry sales in the state. In 2011, creative businesses in Houston had an economic impact of more than $9.1 billion, having grown by 8% since 2001. According to the report, projections indicate that in 2016, employment in Houston’s creative economy will be 16% larger than it was in 2001. The good news reported by Houston is that 9 out of 10 counties in the Houston metropolitan area increased arts-sector employment between 2001 and 2011, showing that the city’s creative economy grew during a decade in which similar cities across the nation experienced decline. In 2014, California’s creative industry output totaled $374.5 billion (direct, indirect, and induced). Property taxes, state and local personal income taxes, and sales taxes generated directly and indirectly by the creative industries were $15.5 billion across the entire state.
Employment and Salaries
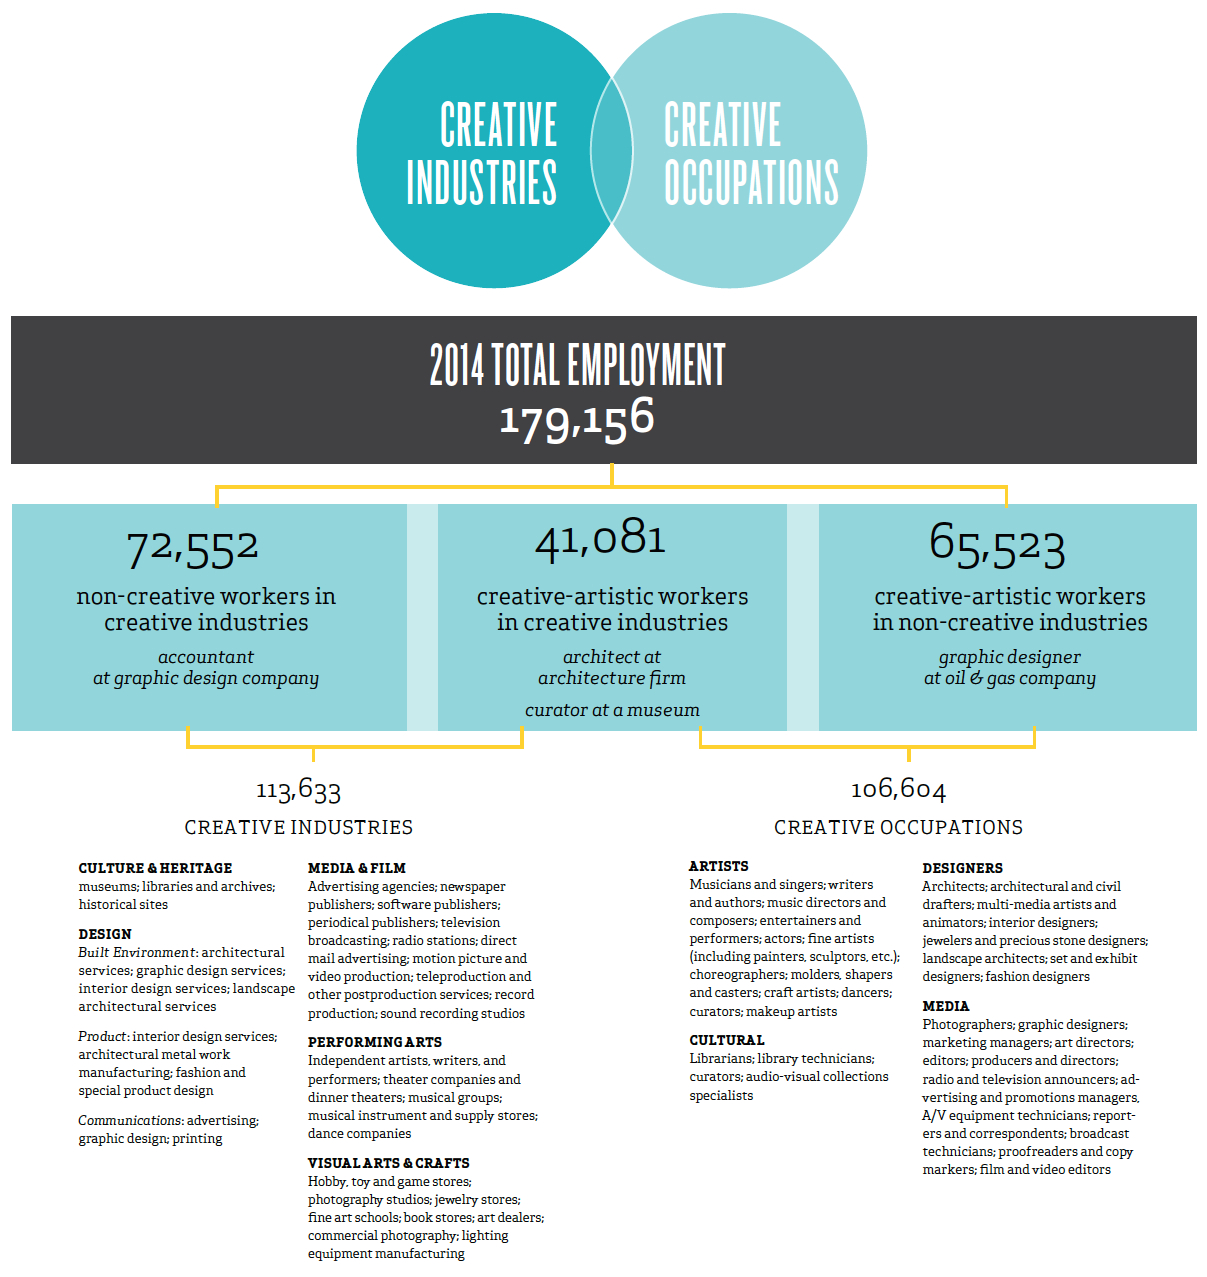
Minneapolis has a strong and diverse creative sector made up of nearly 21,000 jobs, comprising 4.8% of all workers in the city, a figure that is ahead of the national figure of 2.8% for creative workers. Unfortunately, data in the report suggest that despite the wealth of creative jobs in the city, creative employees receive a lower wage when compared to all Minneapolis workers (median hourly wage of $20.79 vs. $25.13, respectively). Nevertheless, despite receiving lower wages when compared to all sectors, creatives in Minneapolis still have slightly higher hourly wages than those of creative workers at the national level ($19.30 and $20.79 vs. $19.19, respectively). In 2011, 146,625 jobs made up the creative economy in Houston; by 2014, this figure rose by 22% to 179,156 (see chart below).
In the same period, creative industries went from earning $4.32 billion to $9.2 billion. When compared to five selected cities (Dallas, Chicago, Los Angeles, Miami, and Philadelphia), the Houston metro area ranks highest in creative sector job growth since 2001. Unlike Minneapolis, Houston’s “ace in the hole” is high rates of pay. When compared to the other cities, Houston is number one in median earnings per creative worker. As a result, while Houston may have fewer creative workers, they are well compensated. This information is even more enticing when Houston’s low cost of living is taken into account. In 2014, California’s creative industry generated 1.6 million jobs, and those wage and salary workers earned $123.5 billion in total labor income. In addition, creative occupations across the state often require high levels of education or skills training. Of the 80 creative occupations identified in the report, 38 required a bachelor’s degree or higher.
A Balanced View: Room for Improvement
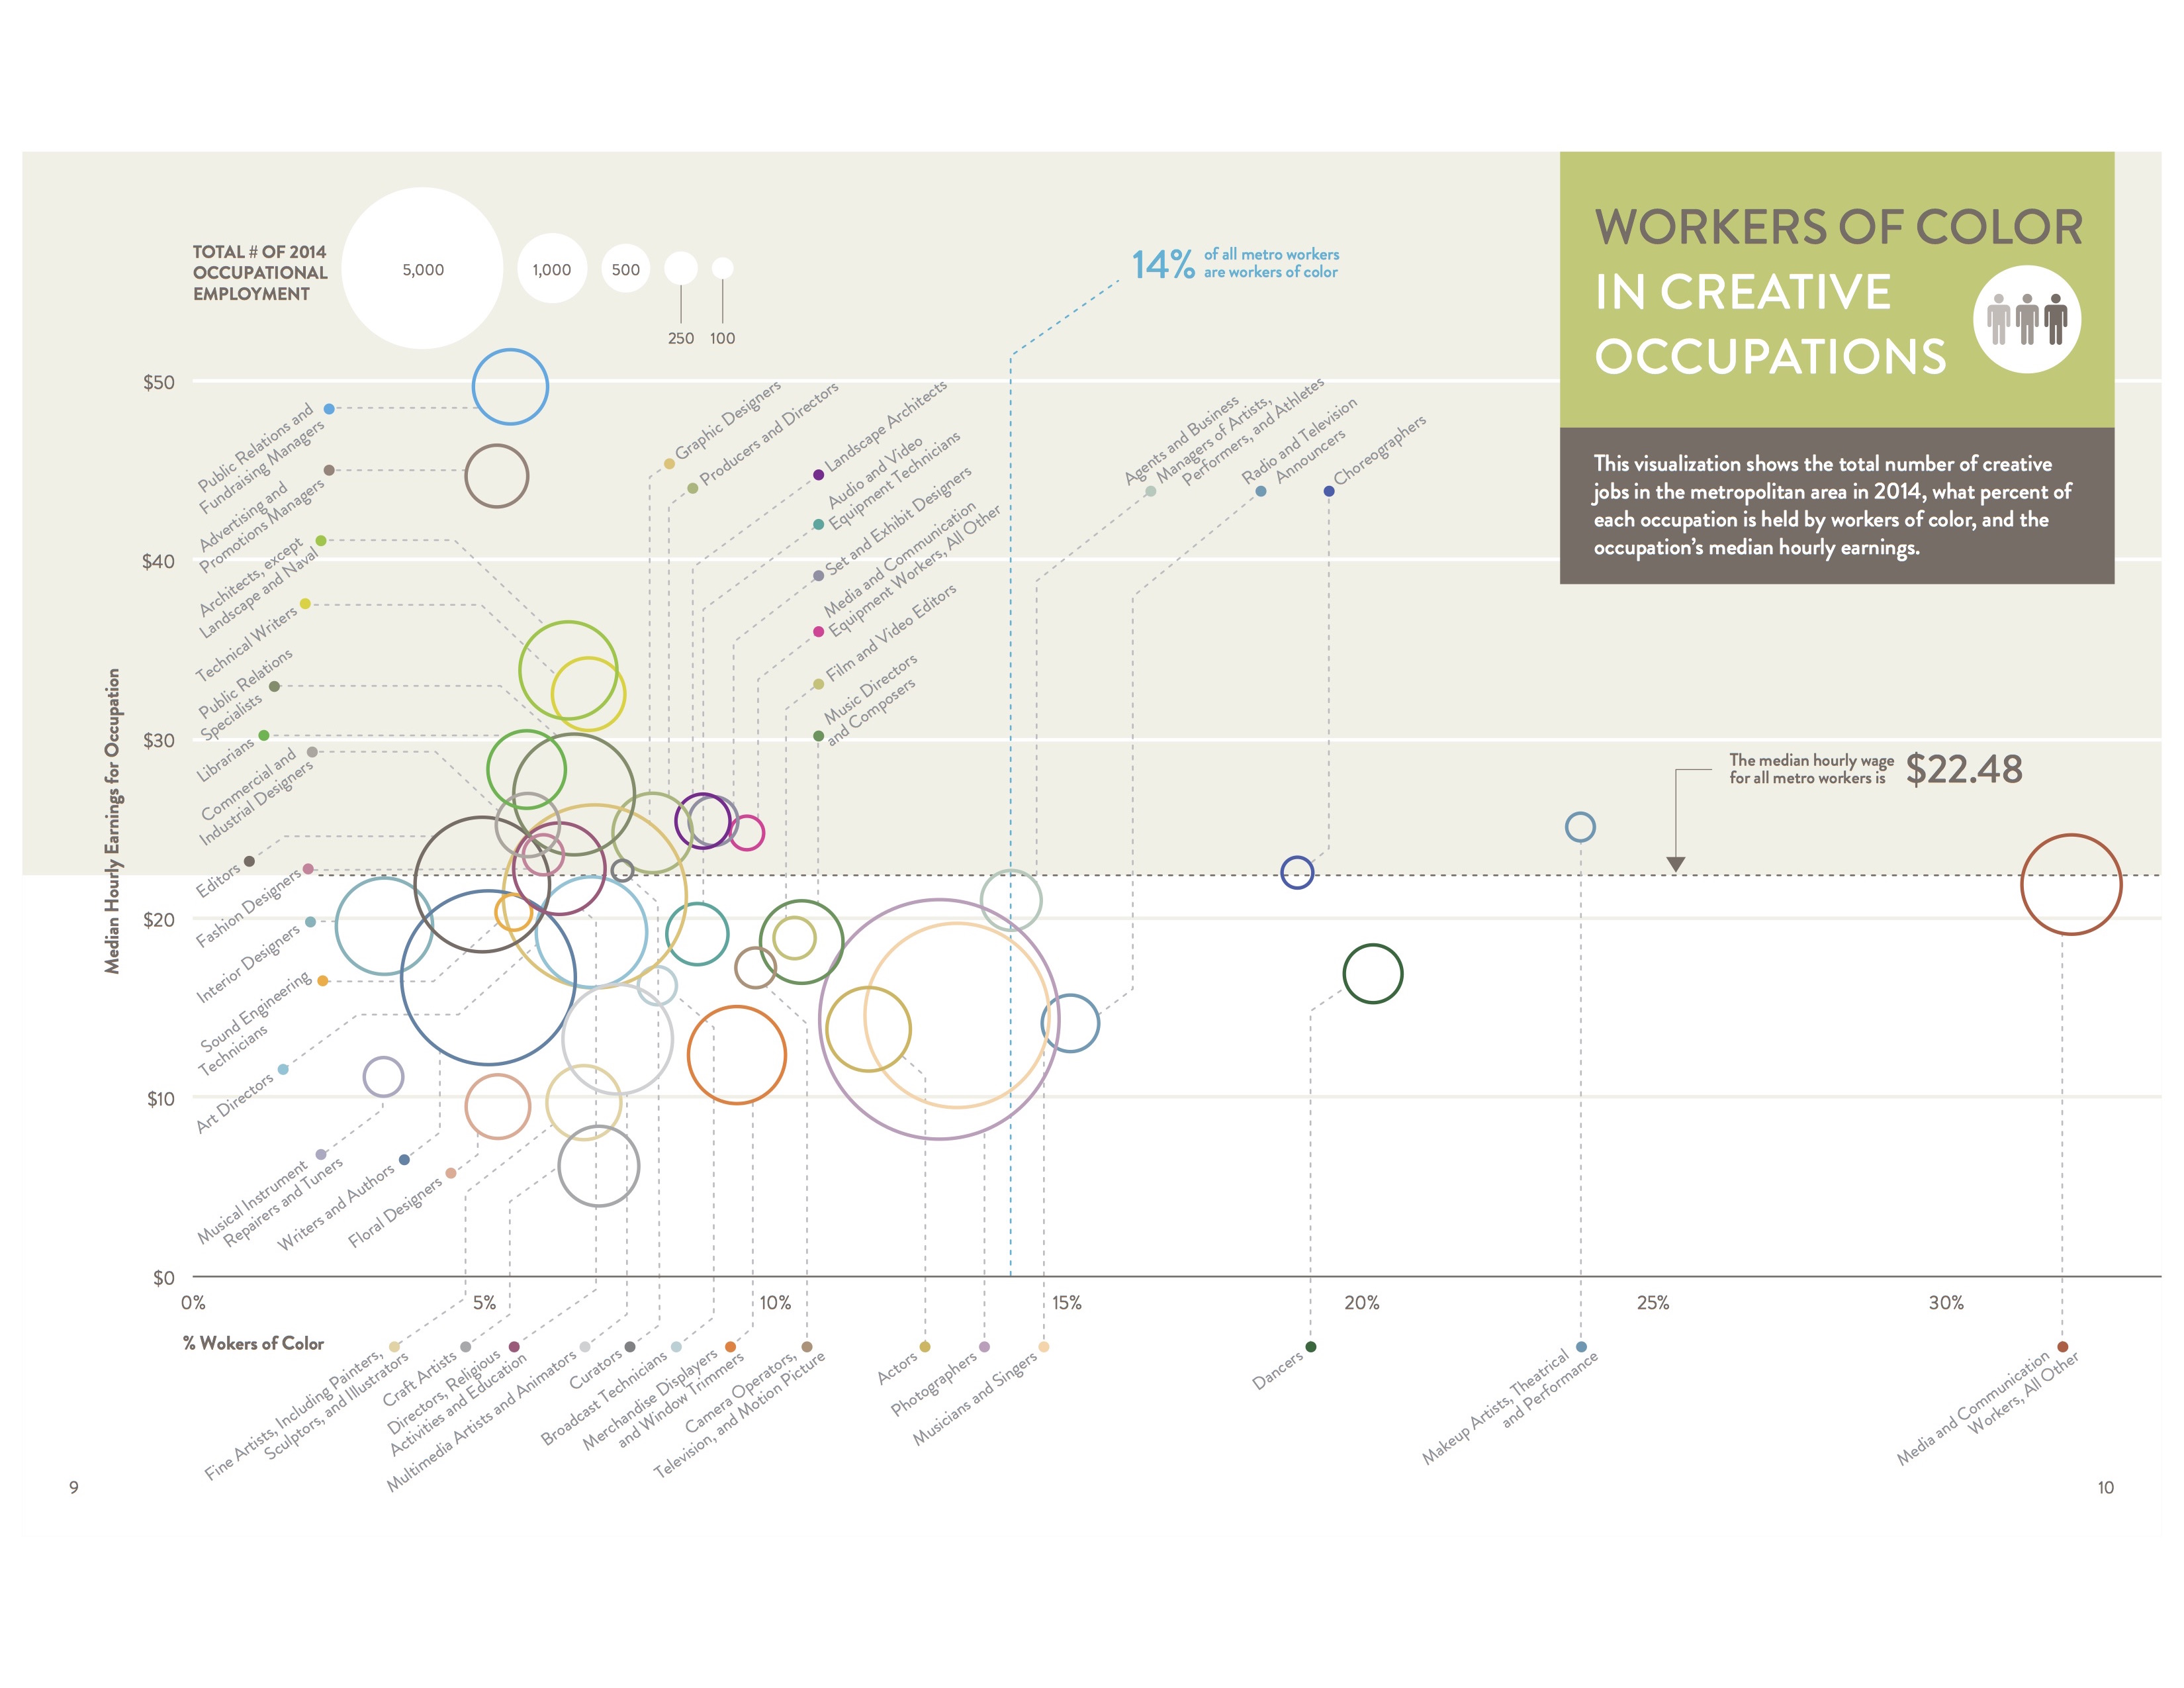
Of course, each report offers a balanced view of the state of the creative economy by highlighting areas that need to be improved and researched further. Minneapolis reveals dramatic income and employment disparities around race and, to a lesser extent, around gender. A lower percentage of people of color work in creative occupations compared to all metropolitan area workers (9% vs. 14%) (see graph below).
In Houston, despite the rapid growth of its creative sector, the city’s creative employment figures are still lower than comparable cities. Houston’s creative economy may be growing rapidly, but other–sometimes smaller–cities still have larger creative sectors than Houston. The city of Houston also faces another challenge: It is underserved by local creative businesses as Houstonians import almost half of the creative goods they use. Today, nearly 60% of Houston’s creative industry are imported. While city residents invest $20.53 billion in creative goods and services, only $10.77 billion of those are provided by local companies. California highlights education as the best path for strengthening the creative economy. Despite having one of the strongest policies on arts education in the nation, “uneven implementation and funding issues have resulted in huge disparities between schools in affluent areas compared with those in low-income areas” (Otis Report, 2015, p. 57).
Conclusion
All of three of the reports reviewed here make strong cases for an optimistic future for their respective creative economies while, at the same time, stressing that more needs to be done. Despite the great strides made by creative industries, a continuous data source is required to enable regular reports and evaluations of a continuously growing industry. In addition, using data to explore the health of creative industries plays an important role in assessing other industries. As the Otis Report on the California Creative Economy states, “the creative industries help drive the stat
e’s economy by attracting investment, tourism and consumer spending and by generating tax revenues. In a post-industrial society, activities based on creativity and culture are an essential feature of a flourishing economy. Creativity and culture also have a non-monetary value in that they contribute to inclusive social development, dialogue and understanding between people” (Otis Report, 2015, p. 17). Data are a vital tool for assessing the state of our creative industries.
To view the full reports click the links below:
The Minneapolis Creative Index 2015
The Creative Economy of Houston 2014
Otis Report on the Creative Economy of California 2015


Comments are closed.