
Emsi, the CVSuite data provider, recently launched Emsi Labs. Emsi provides the data that day to day users utilize within the CVSuite tool. According to Emsi’s blog post, the Emsi Labs are “interactive labor market prototypes” that allows users, “exclusive insights and a glimpse into the future of labor market information.” As sites begin to grow, developers are creating prototypes asking for feedback from their users. Emsi notes that these prototypes will continue to change but urge folks to try them out and provide feedback.
Two of the most intriguing Emsi Labs available currently are the Top MSAs by Occupation or Industry and Wage Distribution by Occupation & Location.
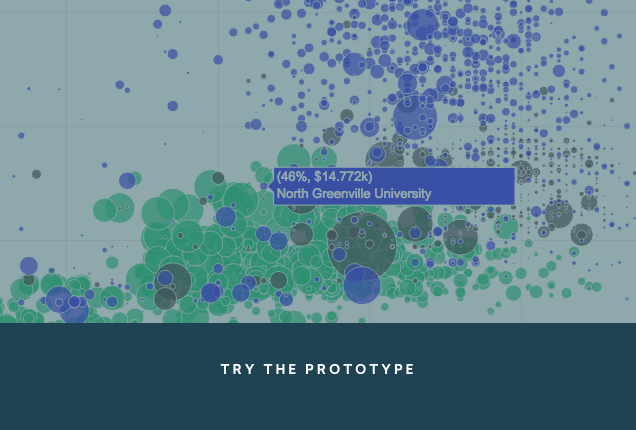
Top MSAs by Occupation or Industry
The Top MSAs by Occupation or Industry prototype allows you to find the top MSAs (Metropolitan Statistical Areas) for specific occupations or industries by concentrations, earnings and employment.
Ever wonder what areas have the most concentrated of Independent artists, writers and performer or do you need to write a report that highlights the highest concentration of dancers? This tool will all you to see the top 10 areas of concentration at a quick glance highlighting the employment within these areas.
Have you ever wondered, how your earnings for independent artists, writers and performers compares to the top 10 areas with the maximum annual earnings?
Maybe you’ve always wanted to know the lowest hourly wages for a specific occupation? You can use this tool to explore where a specific occupation has the lowest hourly wage.

Wage Distribution Estimator
The Wage Distribution Estimator prototype uses 2015 Occupational Employment Statistics to estimate the complete wage distribution. These will be from the 10th, 25th, 50th, 75th and 90th percentile. This tool can be especially helpful if you wanted to compare your labor market data to what is presented in the tool.
Wondering what the wage distribution is for graphic designers within the Denver region? This tool will give you a quick glance on a graph to see the distribution. Evenmore, it provides the average wage per hour for this occupation and area.
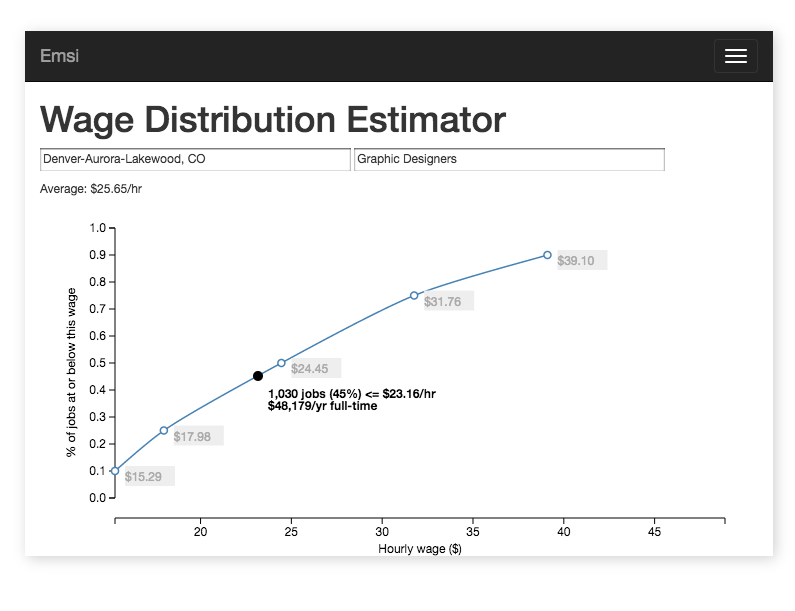
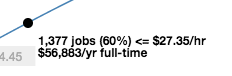
Want to dive deeper in? If you move your mouse over the graph, you will get a breakdown of the information including the number of jobs, job percentage, the wage you are looking at and the yearly salary for that wage.
Test It For Yourself
We encourage you to try out the Emsi Labs. Play around with these tools and see what works and what doesn’t. Developers are continuing to create tests/prototypes like this and we encourage you to utilize the benefits of this trial.
Comments are closed.