Data and Dashboard
The CVSuite software includes 97 creative industries and 85 creative occupations; non-profit revenues, including programming and contributions; and demographic data by occupation and industry.
Our dashboard provides an overview of the creative vitality of your region of analysis. The dashboard will immediately report the number of creative occupations, number of industries, creative industry earnings and sales, and cultural nonprofit revenues. You will also see the Creative Vitality Index value. This value compares the economic vitality of a region’s creative economy to the national economy and to other regions you select to compare with your region. The dashboard also includes demographic information, including population and gender breakdown for the geographic region selected. Coming soon, the tool will report the ethnicity makeup per occupation).
See what occupations are creating the biggest impact in your region, and examine how the numbers have changed over time. In what jobs did significant changes occur? What are the median wages per occupation, and how do they compare to your peer cities or states? What is the concentration of these occupations compared to the US average? All of this and more can be answered using the CVSuite tool.
Perhaps your Economic Development Department wants to bring more technology-driven industries to your region. The CVSuite tool tracks industry growth and decline that can help you monitor the industries coming into or leaving your area. If you need to know what is happening now, take a snapshot view of which industries are currently making up the creative economy of your region. Seek answer to questions such as: How have creative industry sales and earnings varied in recent years? What trends are you noticing in the development of your region’s creative economy? What are the area’s largest creative economy industries?
The CVSuite tool allows users to review nonprofit cultural revenues related to programming and contributions revenues.

Central Source of Data
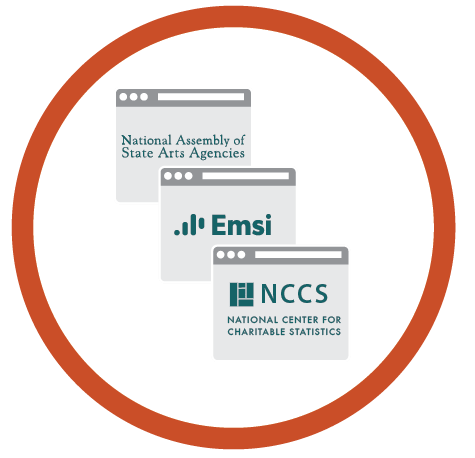
Analyze your region across data sets – at a glance, see both for-profit and nonprofit aspects of your creative economy.


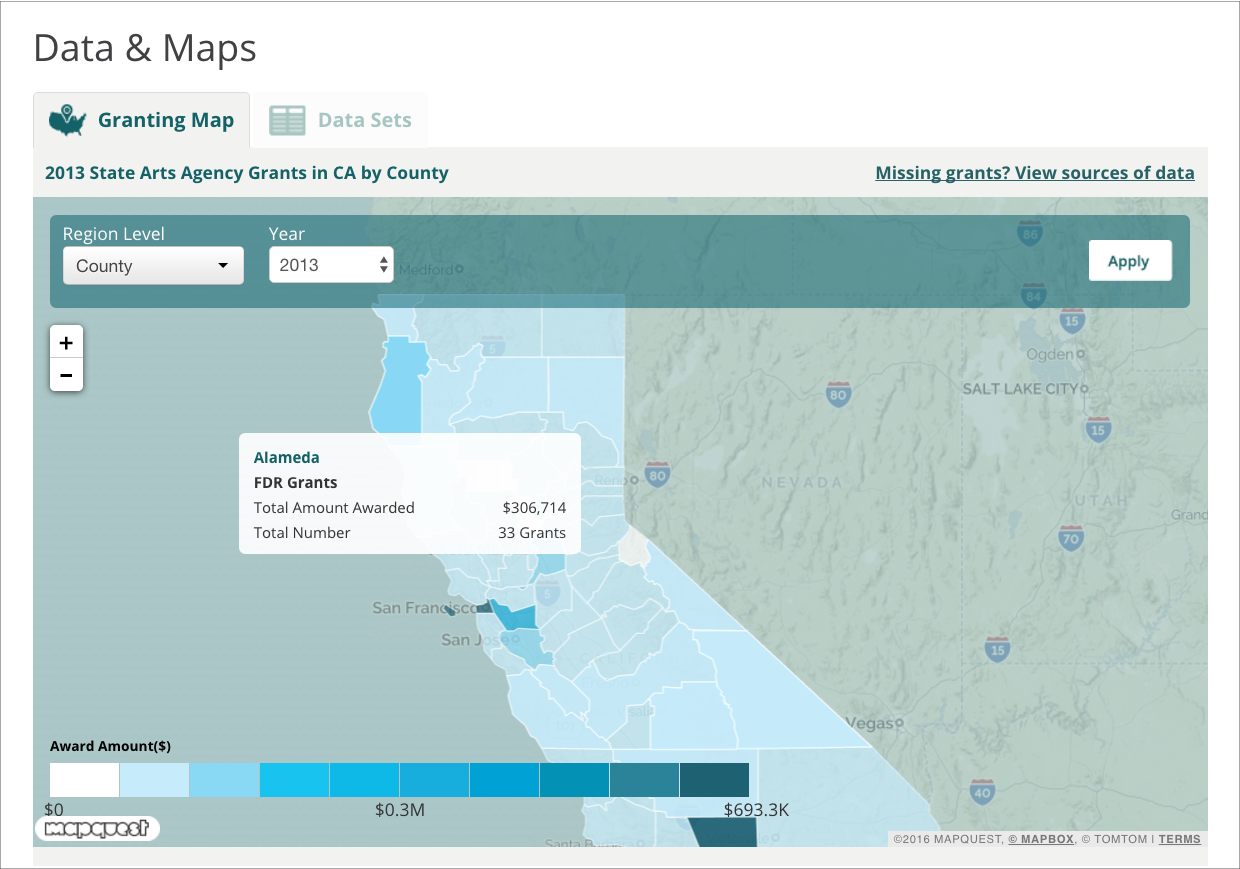
View a map of granting dollars across the state
View your National Endowment for the Arts (NEA) state art agency grant dollars on a map. These data are available by state, county, MSA, ZIP Code and Congressional districts.

