CVSuite™ Data Dives are designed to help those using the CVSuite online data tool explore and put to work the wide array of data in the tool. This month’s Data Dive focuses on how users of the tool can understand their region’s age demographic makeup and what that means for the region as a whole.
To gain an understanding of the economic health of your region, users can identify if the region has an aging population or is attracting younger populations. In this blog, we will discuss the age demographic data that are available and how to analyze this data to meet your goals.
Question: I want to know which creative occupations millennials are attracted to within the region. How can I use CVSuite to analyze my region’s age demographics?
The Creative Vitality Suite allows users of the tool to explore the age breakdown within the region and within the creative economy. Select Data and Maps from the main menu on the CVSuite dashboard. Once on the page, go to Data Sets and select Demographics.

Age Demographics in the Region
The CVSuite tool provides an age breakdown of the entire region. You can view these as values or percentages. In the Salt Lake City, Utah MSA we can see that the 25-34 age group is the second largest age group in the region. Of the entire population, 16.3% of the region is in the age range from 25-34.

Age Demographics in the Creative Occupations
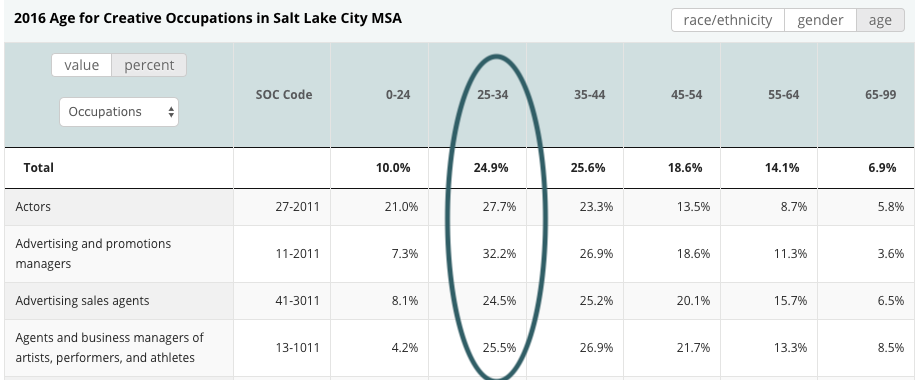
To see if 25 to 34-year-olds are employed in creative occupations, select Occupations from the drop-down menu. CVSuite will display the age makeup for each creative occupation. Keep in mind that the data settings determine what occupations display in this table. You can view the table as values or percentages and can download the data for extensive analysis.
In the Salt Lake City MSA, the 25 to 34 age group makes up 24.9% of the creative occupations. This means that there is a higher percentage of 25 to 34-year-olds employed in the creative occupations than the percentage of young adults in the population.

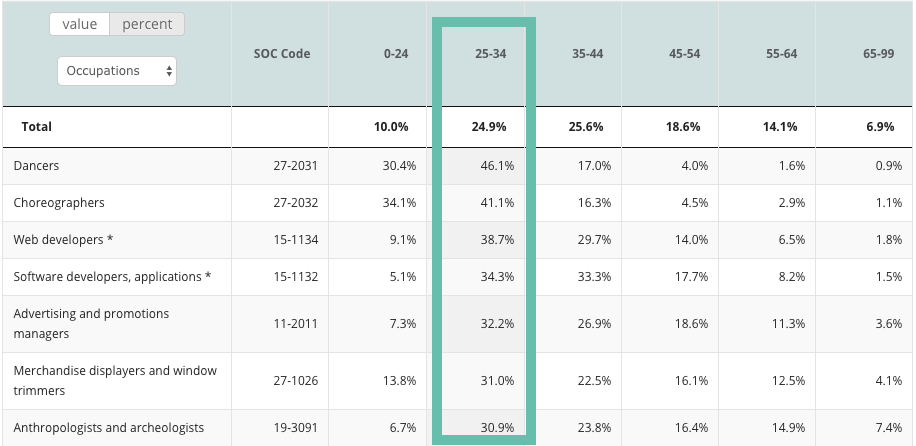
You can also sort the table to find the occupations that are employing the most 25 to 34-year-olds. Knowing the occupations with the highest young adult employment can help you identify which occupations are keeping and attracting younger audiences. In the Salt Lake City MSA, we see that this age group makes up 46% of dancers and 38.7% of web developers. You can also identify which creative industries are employing more 25-34 years old more.

Additional Analyses
The Creative Vitality Suite provides users with tools to identify if there are more 25 to 34-year-olds employed in the creative occupations within their region compared to another region and to the United States. By manually downloading the age demographic data within specific occupations or industries, you can compare your region to another region.
In addition, the CVSuite tool allows you to see the average hourly wage for each occupation. By downloading the Excel spreadsheet on the Occupations tab of the data set, you can identify the average hourly wage for the occupations that have the highest percentage of young adults.

For the Salt Lake City MSA, there are about 34.3% of 25 to 34-year-olds employed as software developers. We can see that the average hourly wage for software developers is $45. The average wages could be used as a recruitment tool for young workers.
In addition, you can compare your region’s average hourly wage to another region. By comparing your average hourly wages to another region, you can gain insight if your region is competitive. Comparing the Salt Lake City MSA to the Denver MSA, we can see that the average hourly wage for software developers is $50.

This information can guide your understanding on how to market your region to younger audience. Although the Salt Lake City MSA’s average hourly wage for software developers is lower than the Denver MSA, they can market to younger audiences noting that the wage difference is minimal compared to a lower cost of living in Salt Lake City.
Conclusion
The Creative Vitality Suite gives you the data to understand your region’s age demographic makeup. Identify key occupations that are attracting and employing younger audiences. Explore how your region compares to peer regions and the nation in terms of attracting younger audiences. The CVSuite provides you with at-a-glance percentages of the age makeup of the region and creative economy. Understanding what is happening in your region is the first step in designing effective platforms to attract audiences. With the Creative Vitality Suite, you have access to the data you need to make informed decisions.
Additional questions to consider include:
- What is the Location Quotient or concentration of jobs for the occupations with the highest percentage of 25 to 34-year-olds? If it is higher than the national average, it may be an indicator that your region is retaining workers in this age group.
- Which creative occupations or industries employ the most 25 to 34-year-olds?
- How does my region compare to the United States and peer regions?
Each month, the CVSuite team will highlight deeper dives within the CVSuite data and tool. Our goal is to help you best analyze the areas you are studying and to tell compelling and comprehensive data-driven stories.
We want to hear from you! If you have a specific question, please email us at cvsuite@westaf.org or call Susan Gillespie at 303.629.1166.


Comments are closed.