Creative Vitality Suite Creative Vitality Suite Creative Vitality Suite Creative Vitality Suite
  • About
  • Products
    • Features
    • Specialized Impact Reports
    • Snapshot Report
    • COVID-19 Impact Reports
  • Pricing
  • Schedule a Demo
  • Creative Vitality List
    • 6 Can’t-Miss Public Art Stops in the Southwest
    • Top 10 Music Cities You Need to Know About
    • The 30 Most Creative Small Cities
  • Resources
    • DataEd
  • Blog
  • Log in
Creative Vitality Suite Creative Vitality Suite
  • About
  • Products
    • Features
    • Specialized Impact Reports
    • Snapshot Report
    • COVID-19 Impact Reports
  • Pricing
  • Schedule a Demo
  • Creative Vitality List
    • 6 Can’t-Miss Public Art Stops in the Southwest
    • Top 10 Music Cities You Need to Know About
    • The 30 Most Creative Small Cities
  • Resources
    • DataEd
  • Blog
  • Log in
Jan 29
Teal background with text that reads New Enhancements and Visualizations

New Enhancements and Visualizations

  • January 29, 2021
  • Natalie Villa
  • New Features and Enhancements, Release Notes, Reporting

The CVSuite team was very busy last year, making several significant improvements to the tool. One of our top priorities has been (and will always be!) our clients and their valuable feedback. We are delighted to announce that in February 2021, we will be launching a new enhancement to CVSuite—to make it even suite-er! 

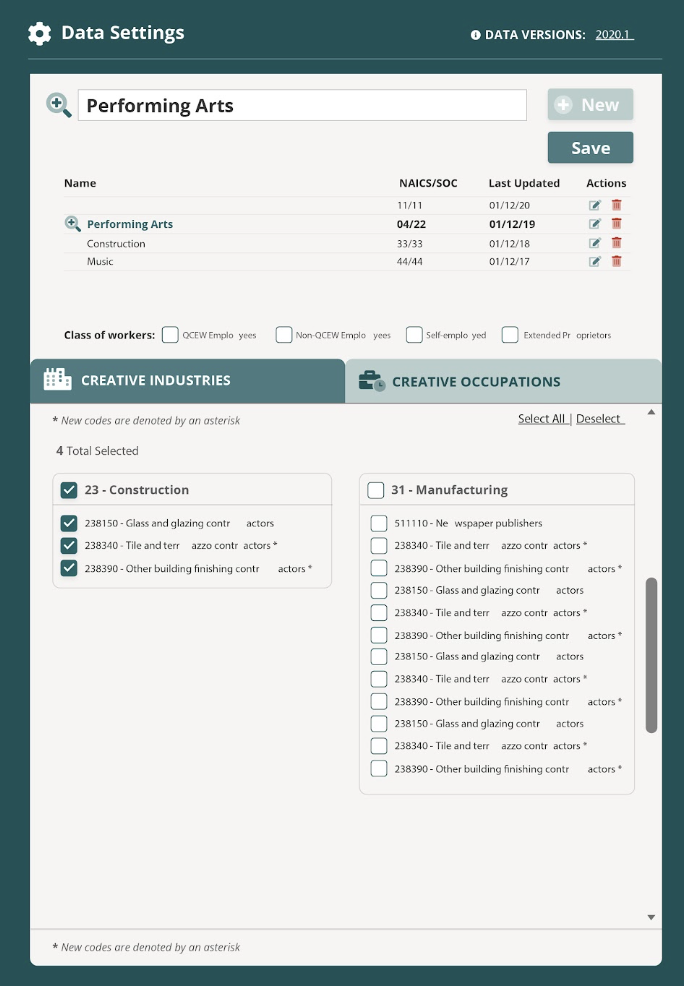
Our clients have been asking for ways to save industry, occupation, and class of worker codes to easily analyze variants of their creative economy. The Data Settings section is being redesigned to allow users to save and toggle between code groupings. You will no longer have to manually change your codes;—simply choose from your saved code groupings and run analysis, such as gig-economy independent artists, regularly employed creative workers or our Creative Vitality Index creative economy codes. Not sure where to start with your code groupings? Don’t worry! In each CVSuite account, users will see the CVSuite code groupings—a great way to start reviewing and analyzing the creative economy in your region. 

Here’s a sneak peek of what’s to come:

But wait, there’s more…

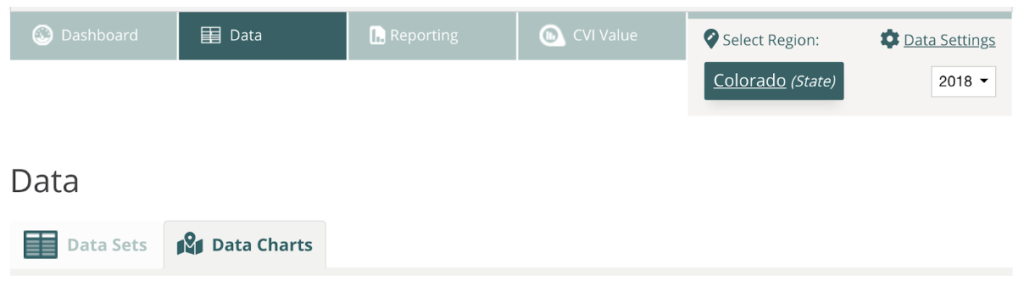
We understand that data can be complex; let’s be honest, nobody really wants to look at numbers all day! Well, now you can analyze your data in a more clear, concise, and appealing manner with our new data visualizations! Access these visualizations by visiting the Data Charts tab, as seen below:

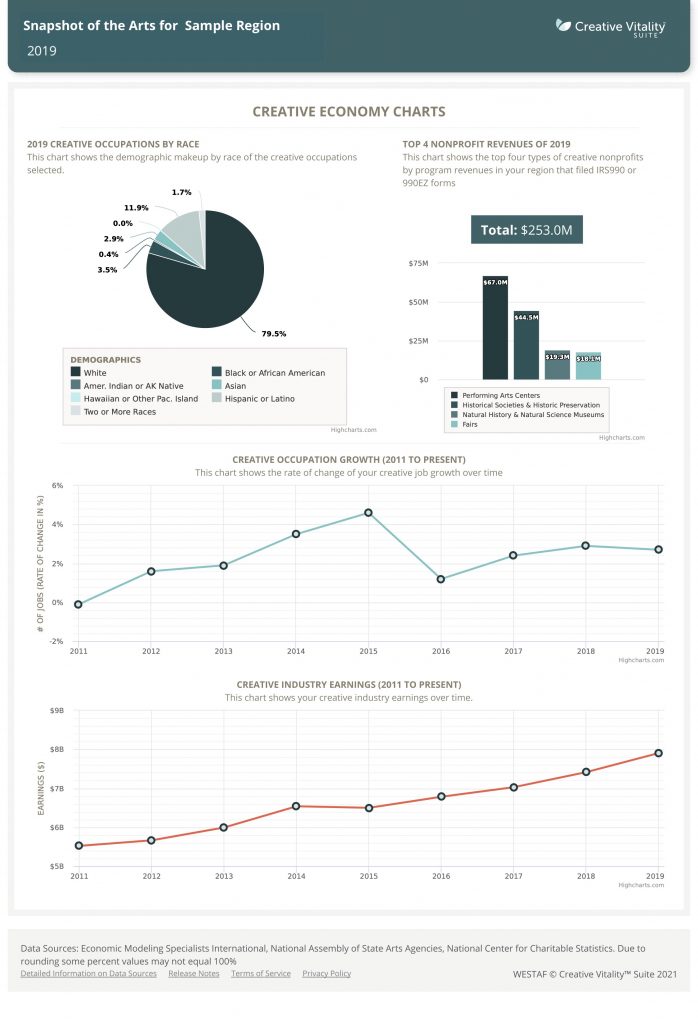
The new charts allow you to easily analyze and interpret your data at a glance and data can also be downloaded to use for your special projects. The charts include:

  • The racial makeup of your region’s creative occupations 
  • The top arts and culture nonprofit program revenues by type
  • The growth rate of your creative occupations since 2011
  • The creative industries’ earnings since 2011
Example of the 2021 charts available in CVS. Includes a bar graph, pie chart, and line graphs.

We Would Love to Hear from You!

Do you have a suggestion or improvement? The CVSuite team is always looking for ways to improve the tool to meet all your needs! Contact the CVSuite team with any questions or suggestions.

  • Facebook
  • Twitter
  • LinkedIn
  • E-Mail

About The Author

Natalie Villa is a project manager who manages and oversees CVSuite contracting and invoicing services, while also working across programs to assist with communication within the CVSuite team. Outside of her work with CVSuite, Natalie acts as the technical project lead for ZAPP and CaFE. Natalie leads the production of instructional videos for many of WESTAF’s art and technology projects. Natalie earned a bachelor’s degree in film and television at the University of Colorado Denver.

Comments are closed.

Subscribe to our Newsletter

Recent Posts

  • Product Update: Announcing New 2021 Data
  • Five Reasons Why You Need Creative Economy Data
  • CVSuite Data Dives: Exploring Alaska’s Creative Vitality
  • DataEd: A Fun, New Way to Become a Creative Economy Expert
  • Top 10 Highest-Paying Creative Occupations in Denver, Colorado

Categories

  • Client Spotlight (4)
  • COVID-19 (2)
  • Creative Economy (66)
  • Creative Vitality List (2)
  • CVI (7)
  • Data Dives (7)
  • Data Education (16)
  • Data Quality (9)
  • Data Sets (18)
  • General (15)
  • New Features and Enhancements (2)
  • Regions (5)
  • Release Notes (1)
  • Reporting (9)

Your source for creative economy data

Contact the CVSuite team for more information on how we can assist you with your advocacy and research needs.

1624 Market St. Ste 226 PMB 98286, Denver, CO, 80202-1559 Phone: 303-629-1166 E-Mail: cvsuite@westaf.org

Contact Info

1624 Market St. Ste 226 PMB 98286
Denver, CO, 80202-1559
Phone: 303-629-1166 E-Mail: cvsuite@westaf.org Web: westaf.org
  • Creative Economy
  • Creative Industries
  • Art Data
  • Arts and Economy
  • Creative Industry
  • Culture Data
  • Home page
  • About
  • Products
  • Creative Vitality List
  • Pricing
  • Resources
  • Blog
  • Creative Economy
  • Creative Industries
  • Art Data
  • Arts and Economy
  • Creative Industry
  • Culture Data
@ 2023 Creative Vitality™ Suite
WESTAF Terms of Service and Privacy Policy