
CVSuite™ Data Dives is our newest initiative to help users explore the wide array of data in the tool and illustrate ways to tell a data-driven story. This month, the CVSuite team will dive deeper into ways to use the Creative Vitality™ Index (CVI™) to compare a region to the national average or another region.
Question: How do I see if my region is more creatively vital than peer regions and the nation?
The Creative Vitality Index (CVI) allows users to quickly

compare creative activity of a region to the United States and other peer regions. Index values greater than one represent more creative activity. Select the CVI Value tab from the main menu on the CVSuite dashboard.
The Makeup of the Creative Vitality Index
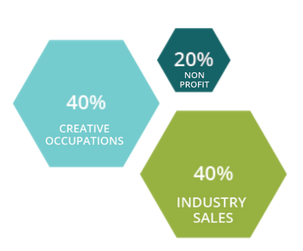
The CVI measures the concentration of the nonprofit and for-profit arts sectors. Data on creative industries, occupations, and cultural nonprofit revenues are indexed using a population-based calculation.The resulting CVI Value shows how a region’s creative vitality compares to another region.
CVI Values Compared to the State and Nation
The CVI value for your region compared to the state and to the United States displays on the Creative Vitality Index section. In addition, the tool shows the general CVI value trends from the past five years.
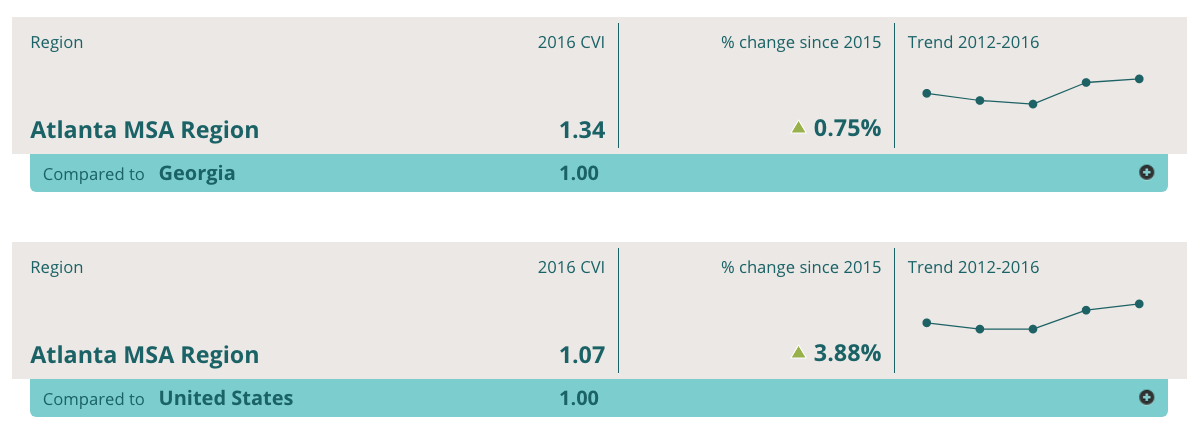
In this example, the Atlanta MSA has a value of 1.34 compare to the state of Georgia. Based on the underlying data, the Atlanta MSA has 34% more creative activity per capita than the state. In addition, we can see that the region’s CVI value increased 0.75% since 2015 and has a general upward trend. The Atlanta MSA has a value of 1.07 compared to the United States, which is a 3.88% increase from 2015.
Making Comparisons
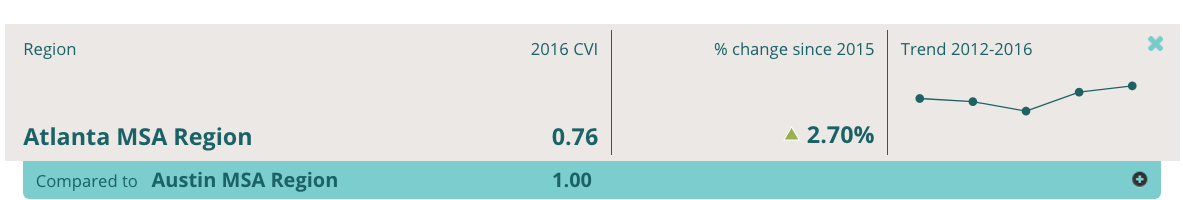
Users of CVSuite can access up to five comparison regions. On the CVI Value page, click the Calculate a New CVI Value. Here you can select your current region and either create a new region or select an existing region. For example, we could compare the Atlanta MSA to the Austin MSA.
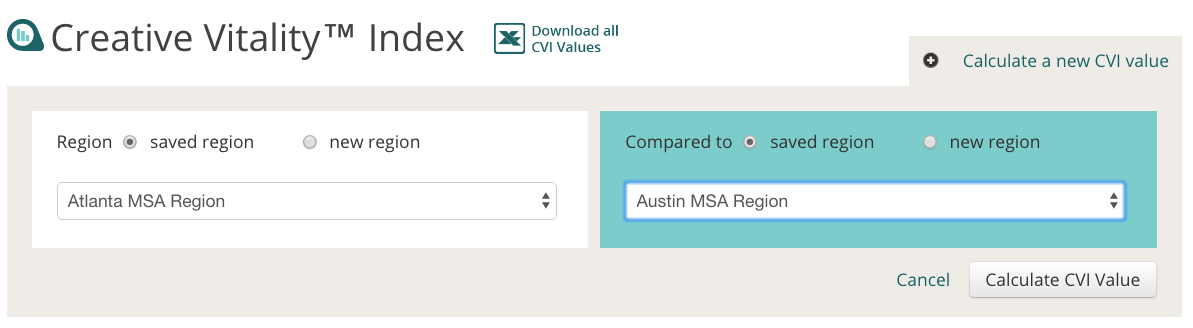
The Atlanta MSA has a value of 0.76 in comparison to the Austin MSA, which is a 2.70% increase from 2015. We can see that the Atlanta MSA continues to grow in creative vitality.
Year-Over-Year Analysis
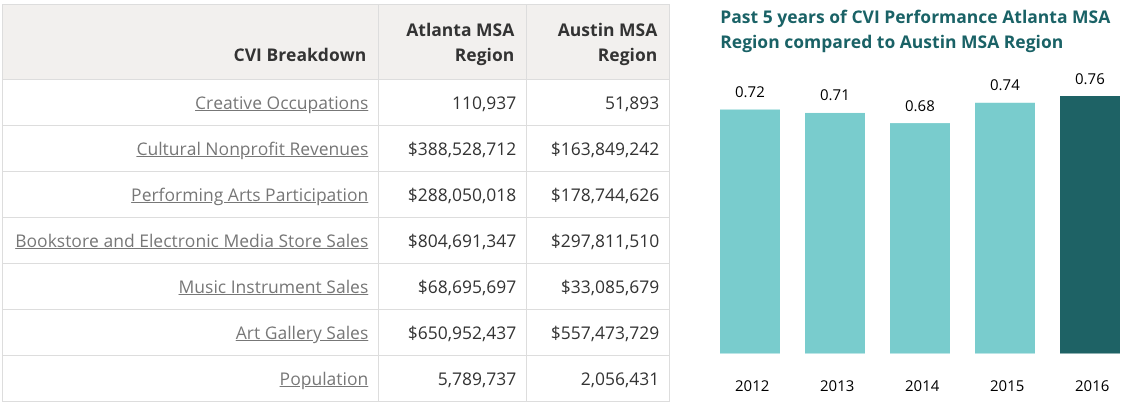
In addition to seeing at-a-glance how a region compares to other regions, the state, and the nation, users of the tool can view the CVI value dating back to 2012. In addition, you can see a breakdown of the CVI value indicators for your region and the comparison region. You can also download all information into a spreadsheet for deeper analysis.
Conclusion
The Creative Vitality Index allows you to see at-a-glance how creatively vital your region is compare to others. With the CVSuite, you can identify strengths and weaknesses and see how you have progressed over the years. The CVI value is included on the Snapshot Report and can be a good indicator of progress made in your creative sector.
Each month, the CVSuite team will highlight deeper dives within the CVSuite data and tool. Our goal is to help you best analyze the areas you are studying and to tell compelling and comprehensive data-driven stories.
We want to hear from you! If you have a specific question, please email us at cvsuite@westaf.org or call Susan Gillespie at 303.629.1166.
Comments are closed.