The CVSuite™ team is pleased to announce Data Dives, our newest initiative to help users of the site learn more about ways to use the Creative Vitality Suite™ tool and its data. The CVSuite offers a wide array of data that can help you tell your story. CVSuite Data Dives explores ways the tool can help you tell your data-driven story.
This month, we will dive deeper into the newly available race and ethnicity data in the CVSuite tool. We explain how you can use the data to compare the diversity present in the creative economy in your region with that of other regions in the country or the country as a whole.
Question: As my region becomes more diverse, is the cultural sector keeping up?
To view the CVSuite race and ethnicity data after logging in: 1) Visit the Data & Maps section; 2) Select Data Sets; and 3) Choose Demographic.

The CVSuite provides a breakdown of race and ethnicity data in three ways for each region that is selected: a) by overall population; b) by occupation jobs; and c) by industry jobs. View these as values or percentages. Values will display the number of people who identify as the specific race or ethnicity within the region, occupation, or industry.

Exploring Your Region’s Racial and Ethnic Makeup
This is a simple two-step process: a) Choose percent and b) Select region to view the racial and ethnic breakdown of the region you have selected. The example below indicates that black or African Americans make up 33% of the Atlanta MSA’s population.
Understanding Your Region’s Creative Sector
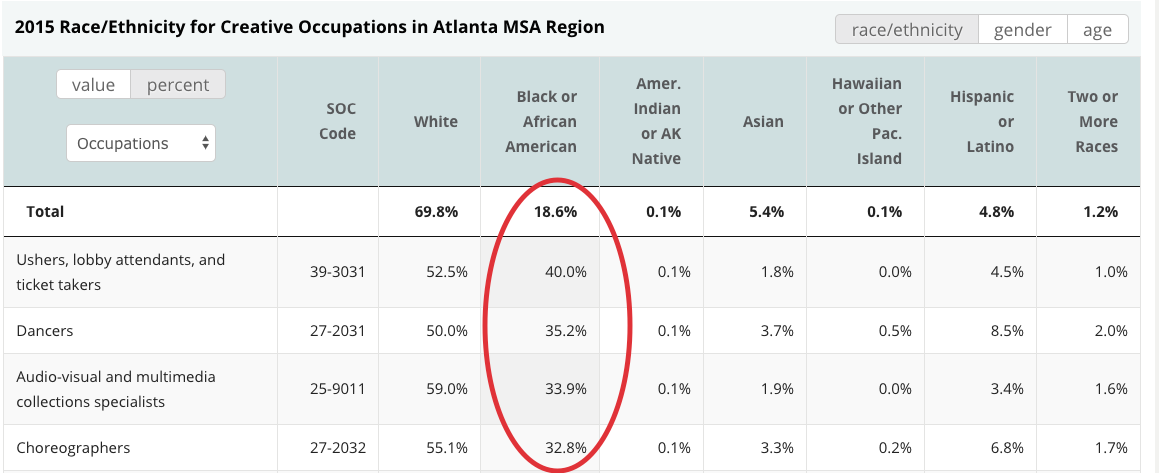
Now select occupations. We can see that African Americans hold 18.6% of creative occupations in the Atlanta MSA. You can also see which occupations are more inclusive by viewing a breakdown of the racial and ethnic groups within the creative occupations.

Select the header row twice to sort the occupation breakdown in descending order. By doing this, you can see that there is more diversity with African Americans in specific occupations than there is in the general regional population.

You can also export this data to a spreadsheet where you can continue to analyze your region. Users can also identify specific industries in a region for analysis following the instructions above.
You can see how your region’s inclusivity is increasing or decreasing by analyzing a region’s creative economy year-over-year. You can also use this information to help evaluate how successful your inclusivity initiative is.
Conclusion
The Creative Vitality Suite tool allows users to dive as deeply into the data as they need. It is simple to compare the diversity of your region to that of the creative sector with CVSuite.
Not only can you use the tool and data to learn how diverse the creative sector is within your selected region, you can also learn the answers to the questions listed below–and more! Some of the questions you might research include:
- What creative occupation is the most diverse in my region?
- Has the diversity of the creative economy improved or declined in the past three years?
- What areas of the creative sector do we need to improve, in terms of racial and ethnic diversity?
- When looking at the entire state, how does my city or ZIP Code region compare to another in terms of diversity in the creative sector?
Each month, the CVSuite team will highlight deeper dives within the data and tool, helping you to analyze your region and tell your comprehensive data-driven story.
We want to hear from you! If you have a specific question, please email us at cvsuite@westaf.org or call Susan Gillespie at 303.629.1166.


Comments are closed.