Introduction
The Creative Vitality Suite™ (CVSuite™) recently added race and ethnicity data to its online tool. In the past, such data have been available to a limited degree. Now, however, the new ability for CVSuite users to access and analyze demographic data has the potential to greatly broaden the creative economy field’s understanding of such things as trends in employment diversity. This is important because research increasingly suggests that diversity in the workplace stimulates creativity, adds perspectives to problem solving, and contributes to the generation of revenues.
Using its new data capability, the CVSuite team investigated the presence of racially and ethnically diverse employment in creative economy occupations throughout the United States. The team then compared those findings to the level of such employment in all occupations throughout the economy of the United States. For the purpose of this investigation, racial and ethnic groups other than white are classified as minorities. Using the latest update of data that was available for the first quarter of calendar year 2017, the CVSuite team found that when compared to employment patterns in all other occupations at the national level, creative occupations were 8.2% less racially/ethnically diverse.
The racial and ethnicity data used in the CVSuite originates from a combination of national sources, including the Bureau of Labor Statistics Quarterly Census of Employment & Wages (QCEW), Occupational Employment Statistics (OES), National Industry-Occupation Employment Matrix (NIOEM), the US Census Bureau’s American Community Survey (ACS), and the Quarterly Workforce Indicators (QWI). Economic Modeling Specialists International (EMSI), CVSuite’s data partner, cleans and revises these data by geographic region. The Q1 2017 data in this analysis are from the most recent projections by EMSI on this subject.
The Analysis
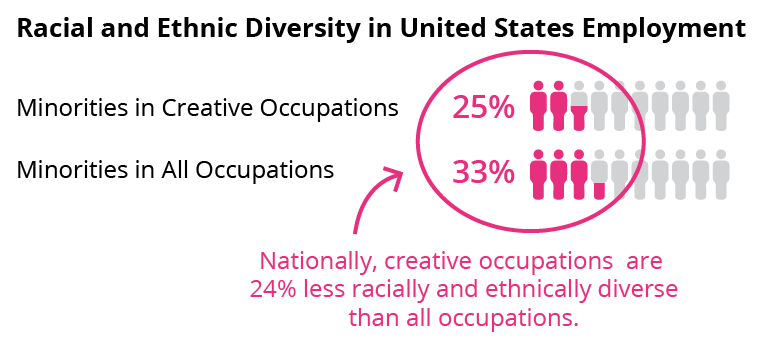
To better understand the role racial and ethnic diversity plays in creative economy employment, the CVSuite team analyzed the earnings and minority percentages in 59 creative occupations. One finding was that, 33% of workers in the overall economy classify as a minority, while in the creative occupations, only 25% of all workers classify as a minority. Thus, creative occupations are 24% less racially and ethnically diverse than all occupations. The team also discovered that in creative occupations with high levels of racial and ethnic diversity, there are greater concentrations of employees in low-salary positions.

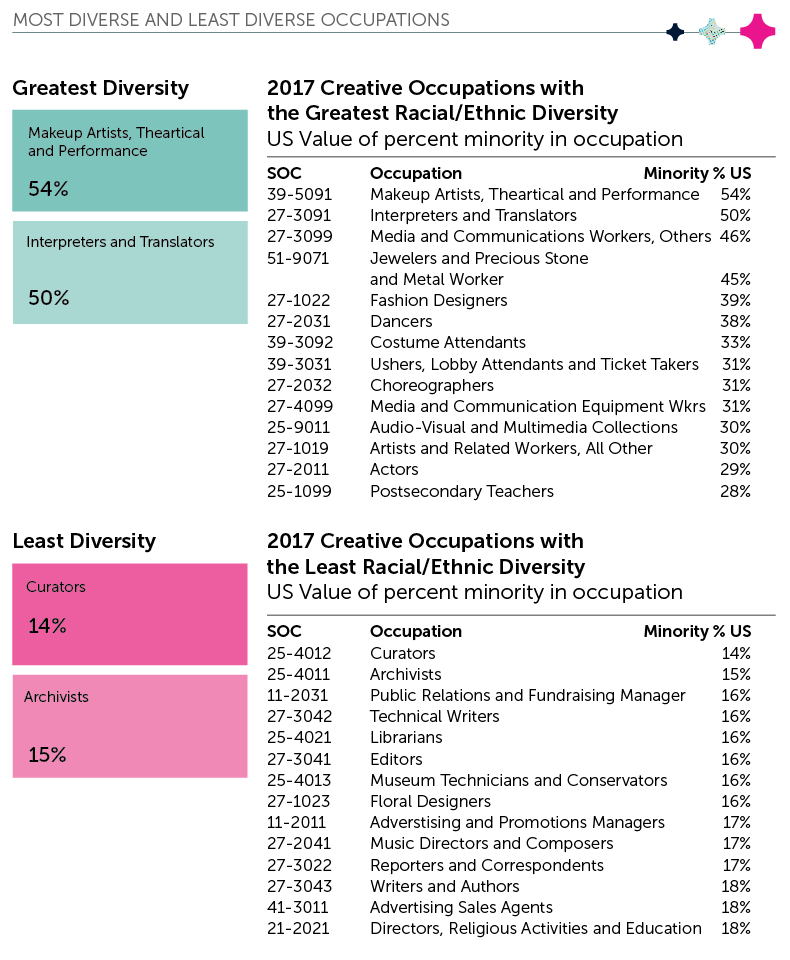
A review of the top and bottom quartiles of minorities in creative occupations reveals which creative occupations are more and which are less diverse. The occupations with the greatest concentration of minority employees include makeup artists, interpreters and translators, and media and communications workers. The occupations with the least diversity include higher paying occupations such as curators, archivists, and public relations and fundraising managers.

Why Diversity Matters
The CVSuite can be used to reveal information about a number of features of the creative economy. The level of racial and ethnic diversity among employees in creative occupations is one dynamic that should be of interest to those seeking to build thriving creative economy sectors. In recent years, a number of researchers have suggested ways that diversity in the creative economy workforce matters. While some of their writings are preliminary and exploratory in nature, they are presented here because we believe a review of current thinking in this area will help users of the CVSuite understand why making use of the new demographic data in the CVSuite tool can support their overall efforts to build a stronger creative economy.
Articles addressing the value of diversity in the creative workforce are appearing with increasing frequency. In Why Diversity Matters in Tech, author Murray Newlands states, “Diversity is not just a ‘right thing to do’ issue; it’s not even a ‘good-for-society’ issue. Diversity is absolutely integral when it comes to swiftly developing STEM industries.” In the article Diverse Teams Feel Less Comfortable –– and That’s Why They Perform Better, David Rock, Heidi Grant, and Jacqui Grey discuss how diversity can highlight differences, making teams more creative. According to the article, a 2012 study tasked three teams with designing a creative business plan for a theater. The study found that “on some teams, members were assigned distinct roles (Artistic, Event, and Finance Manager), thus increasing diversity of viewpoints. These teams came up with better ideas than homogeneous teams.”
Diversity doesn’t just foster more creativity; there are now studies that highlight how diversity can stimulate earnings. The Harvard Business Review’s Why Diverse Teams Are Smarter by David Rock and Heidi Grant references the 2015 McKinsey Report on 366 public companies, noting “that those [public companies] in the top quartile for ethnic and racial diversity in management were 35% more likely to have financial returns above their industry mean, and those in the top quartile for gender diversity were 15% more likely to have returns above the industry mean.”
Comparing Your Region’s Occupational Diversity to Population Demographics
Discovering how diversity in your region’s population is reflected–or not–in the diversity of the area’s creative workforce can prove instructive. By using the most recent data in the CVSuite tool, researchers can analyze how the diversity in the region’s general population compares to a region’s creative occupation diversity. The CVSuite currently contains 2015 data. Data from 2016 will be added this fall, and 2017 data will be included during the spring of 2018. As an example of how to pull useful data on this subject from the CVSuite, the CVSuite team examined three metropolitan statistical areas (MSA) with high Creative Vitality Index values.
- Santa Fe, NM, (3.38 cvi)
- Washington-Arlington-Alexandria, DC-VA-MD-WV (2.47 cvi)
- Pittsfield, MA (2.36 cvi)
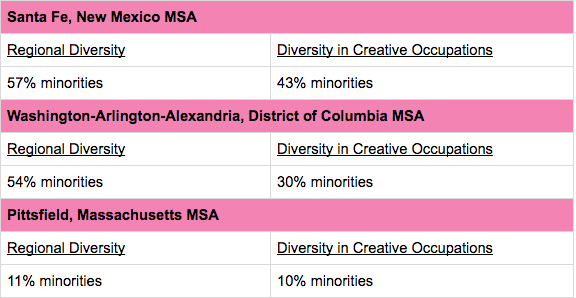
Using the CVSuite tool, the team compared the regional diversity in the population of these MSA’s to the diversity within the creative sector. These were then compared with the national average for diversity occurring in employment and to the national average of 23%.

From the table, we see that the Santa Fe and Washington-Arlington-Alexandria have greater diversity in creative occupations than the national average. Sante Fe has a substantial number of minorities working in creative occupations (43%), while the diversity of creative occupations in the Pittsfield area is below the 23% national average. It is important to note that Pittsfield’s percentage of minorities in the workplace is similar to the region’s population diversity. Sante Fe and Washington-Arlington-Alexandria have yet to employ enough minorities in creative occupations to match their population demographics.
Conclusion
Efforts continue to to be made to understand the value of diversity in the area of employment in the creative economy. As the potential value of having a diverse workforce is more fully understood, employers can be expected to consider ways to increase efforts to cultivate a more diverse creative sector workforce. The CVSuite tool can assist in this work by providing credible national and local level data as well as comparative data that can establish an understanding of conditions as they exist, thus providing a foundation upon which to build a plan to increase diversity. Accessing and analyzing this data is a great way to start and then nurture this work.
Methodology
The data in this study represents the diversity in QCEW occupations as projected for the year 2017. Although calendar year 2017 has not concluded, the data are projected based on EMSI’s modeling of their 2017.1 data release. EMSI works with large data sets from numerous sources. The data is combined to create the occupation demographic data which are then modeled to project trends for the year 2017. EMSI builds the job data on the foundation data from the Bureau of Labor Statistics Quarterly Census of Employment & Wages (QCEW) from 2016 Quarter 2.
The industry jobs data are converted into occupations jobs using the Occupational Employment Statistics (OES) from 2015 and the National Industry-Occupation Employment Matrix (NIOEM) from 2014-2024. The demographics of occupations are then informed by the US Census Bureau’s American Community Survey (ACS) from 2015 and the Quarterly Workforce Indicators (QWI) from 2016 Quarter 2. Finally, the occupations jobs demographics for the current year are modeled. As new sources are released EMSI and the CVSuite update the data to provide the most reliable and current data available.


Comments are closed.