
Now that you have high quality economic data to measure your creative economy, you’ll want to present that data in a format that can be easily understood. There are many tools available online to help you work with your data, but it can be difficult to decide which ones to invest your time and resources into learning. We’ve put together a list of seven free chart tools to help you decide which to use to tell your story.
Google Charts
Google’s powerful, free chart tool allows you to choose from a gallery of static and interactive charts to upload to your website. Google Charts is especially useful for static charting and as an alternative to Excel. Strength: With a library of online guides to help you, this tool is easier to use than most and works well with Google spreadsheets. Weakness: Limited on customization and design.

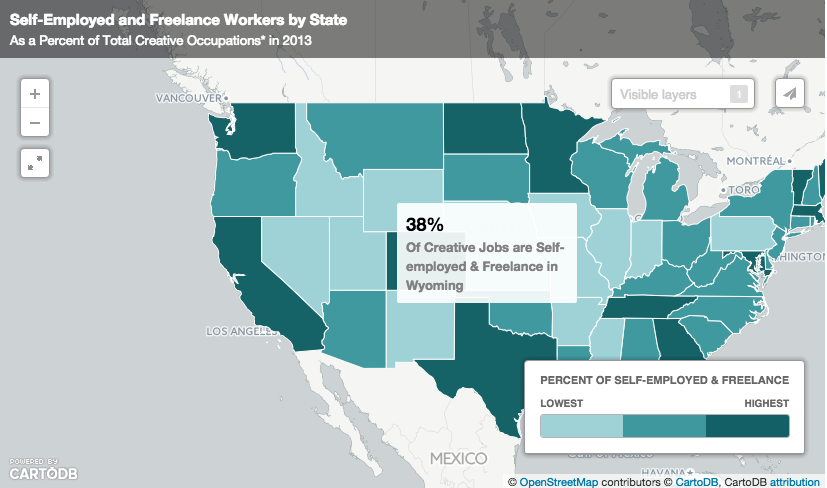
CartoDB
Mapping and analyzing location data is easier with CartoDB. If you’re looking to add a lightweight GIS system to your website, this free tool could be perfect for you. Strength: Solid customization features give you more flexibility in the design so you can match your charts to your unique brand. Allows for import of shapefiles. Weakness: Requires some technical knowledge. You may need help from someone with GIS knowledge or development experience.
Infogr.am
Improve your data visualization with charts and infographics through Infogram. Their free plan offers 10 infographics and 10 uploaded images, and their paid plans are reasonably priced. Strength: User-friendly design featuring bold and elegant charts and graphics. Weakness: You must have a paid subscription to download.
Plotly
Relatively new to the scene, Plotly is a straightforward and flexible platform that can help you create polished charts, graphs, and scatterplots which you can export to multiple formats. Strength: Professional and highly customizable visuals of data. Weakness: Requires some data and charting know-how. Still in Beta and occasionally down for maintenance.
Tools for more advanced users
Raw
An open web app for D3 advanced charting, Raw utilizes a D3.js library to help you create advanced and highly modifiable charts over and above typical line, pie, or bar graphs. Strength: Simple point and click interface with embedding capabilities does not require coding knowledge. Weakness: Advanced charting is only available for specific types of data, so check to make sure it works for your data set before taking the plunge.
OpenRefine
Before developing charts and mapping your data, you may need to clean it first. This powerful tool helps you prepare your data for visualization by identifying missing values and incorrect formatting. OpenRefine can also extend data with web services and link it to databases. Strength: Systematically cleans data and finds errors prior to charting and analysis. Weakness: Requires greater level of tech know-how, so the learning curve may be high.
Google Fusion Tables
For more advanced charting and larger data sets, try Google Fusion Tables. If you’re already a pro with Google Charts, this free chart tool will take your data visualization skills to the next level. Strength: Perfect for working with much larger data sets, Fusion Tables also makes it easy to combine multiple data sets and allows for advanced mapping. Integrated with Google Drive. Weakness: If you’re a beginner, you’ll want to start with a more user-friendly platform before graduating to this tool.
Choosing the right free charting tool is the first step in telling the story of your creative economy. Get started with current and reliable economic data today!
Comments are closed.