
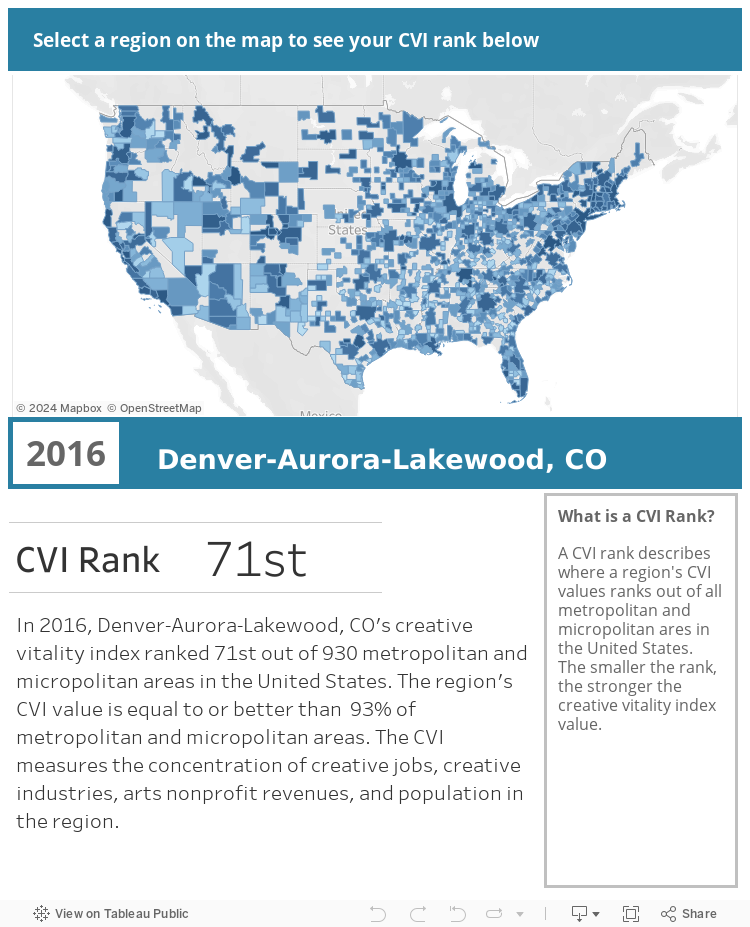
The CVSuite’s Creative Vitality Index – or CVI Value – compares the per capita concentration of creative activity in a region compared to the United States. Select your region below to see your Creative Vitality Index rank.*
The visualization displays CVI ranking among all of the metropolitan and micropolitan statistical areas within the United States.
How vibrant is your creative economy?

Creative Economy Data
for a region of your choice!
Learn more about the CVSuite tool, data, and our services!
Creative Vitality Index Methodology
The Index includes indicators from the for-profit and nonprofit arts sectors. 60% of the CVI measures arts participation from industry sales and nonprofit revenues. The remaining 40% is attributable to creative occupation jobs.
The CVI Rank sorts all metropolitan and micropolitan CVI values from highest to lowest. The smaller the rank, the stronger the region’s CVI value. Vineyard Haven, MA, Summit Park, UT, Jackson, Wy, Sante Fe, NM, Glenwood Springs, CO, and Washington-Arlington-Alexandria, DC-VA-MD-WV ranked the highest in CVI values in 2016. These cities had very strong creative activity concentration per capita.
Note: Data is sourced from CVSuite’s 2017.3 data version.