As the head of an arts management graduate program, I am always on the hunt for new ideas, learning opportunities, and cutting-edge resources for our students and faculty. I know that access to scientific information is critical to any quality education and learning process. At the most basic level, quality data refers to the condition of information people use to inform decision making. In action, quality also has to do with making meaning — or how we are able to structure, categorize, and analyze information so we can learn from it and use our understanding to care for our world.

WESTAF’s Creative Vitality™ Suite (CVSuite™) is a breakthrough for learning because the online tool allows us to see into large data sets and personalize information via a dashboard. For Californians, the CVSuite lifts a heavy veil that has been shrouding diversity data for over twenty years since the passage of Proposition 209. While Prop 209 was confusingly titled the CA Civil Rights Initiative, it had the opposite effect. It made it more difficult to collect and analyze data on ethnicity and race in the cultural workforce. This has made it more difficult to target initiatives for positive change. What we cannot see, we cannot change. Colorblindness is the new racism. While we can all rally around the idea of equity and inclusion, it’s unlikely we will ever achieve that goal without understanding the different conditions that people face in their lives. Good data help us see what is, so we can do better.
Interactive Dashboard
The dashboard in the CVSuite tool allows you to personalize and refine the data sets you care about most. If I want to analyze the particular occupation codes for a better understanding of strides in that area, I can select and analyze only those codes.
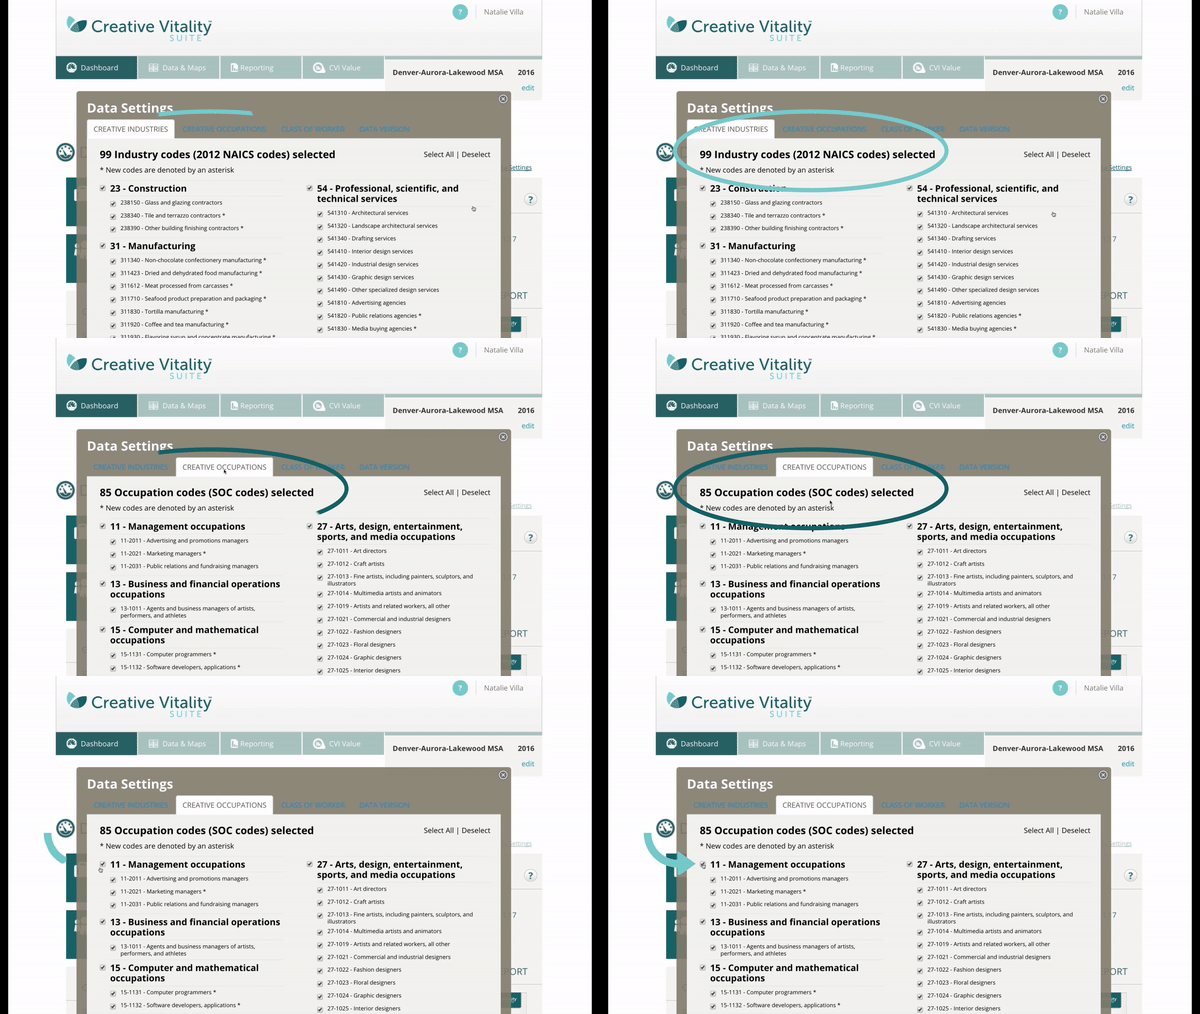
But for me, I need to be able to understand how age, identity, and place will impact my students’ futures. As a professor whose work is grounded in social practice, I am committed to preparing my students for futures in the real world ––the one that is, and the ones we can imagine.
The work we do in education is an important part of the larger arts ecosystem and is best informed by real quantities and information. The CVSuite tool helps me personalize data and identify emergent trends and historical precedents to better prepare my students, inform our participatory research, and serve artists and arts organizations in our region.
Using the dashboard, I can look at levels of participation in different sectors of the creative industries and occupations by ethnicity and age. Importantly, the CVSuite tool uses the same categories for ethnicity and race that are commonplace in census data. This allows me to see the disparities that currently exist in our field so I can do my part to guide our own inclusionary strategy through new coursework, participatory research, and community partnerships.
Demographics and Careers
In Los Angeles, our County Board of Supervisors recently approved the Cultural Equity and Inclusion Initiative (CEII) put forth by the Los Angeles County Arts Commission. The CEII aims to guide public policy and investment to achieve cultural inclusion in the arts. I ask myself: “As a professor, what steps can I take to create a world of opportunity and inclusion in the arts?” First, I have to see what is to be able to imagine what might be. This requires wedding my values to information and action where I live and work.
The CVSuite tool helps me answer questions like: How are different communities fairing in the creative industries in my region in relation to the larger population? I learned through using the tool that, in Los Angeles, while whites are 27% of our regional population, they represent 61% of those who are employed in the creative sector. That means that 34% more whites are finding work in the creative industries than are represented in the local population.
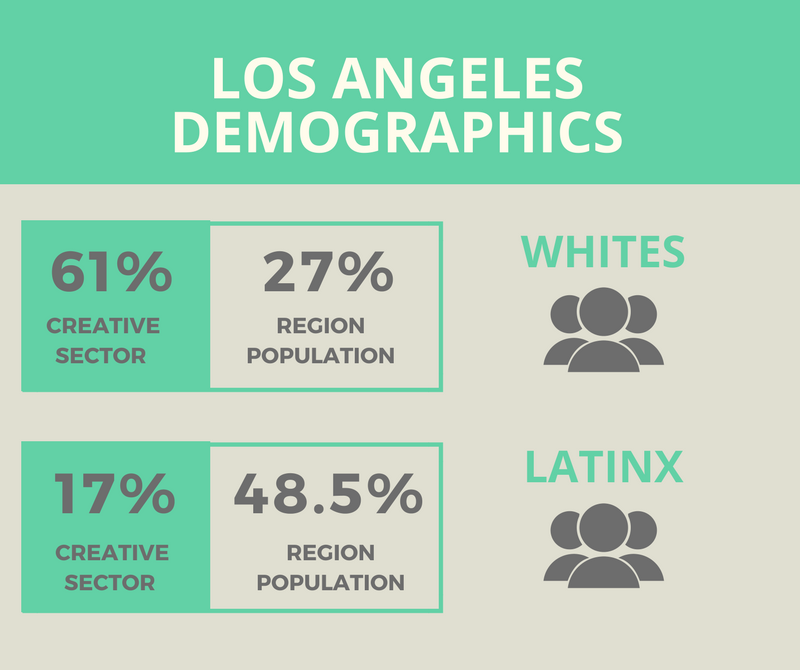
Los Angeles is the Spanish word for angels, and our geography is inherently connected to Central and South America. It is upsetting to note that while 48.5% of the LA County population identifies as Latinx, only 17% of people employed in local creative industries are Latinx. That means that there are 31% fewer Latinos in the creative sector than in our general population.
While African descended peoples were present among the first pobladores of Los Angeles, and are currently 8.1% of our general population, participation rates for black cultural workers in the creative industries are not equivalent to the population size. Instead, we see a 2.3% decrease than should be expected. While a few numbers might seem small, they represent thousands of lives.
The creative sector employment rates among Asian Pacific Islanders (API) echo the same as in the general population, but CVSuite can help excavate the details of this figure by seeing which creative industries are more welcoming to API creative and which specific industries could benefit from greater inclusion.
Diversity in Creative Industries
The CVSuite tool lets us study the particularities of different creative industries to understand which aspects of the field are doing better or worse at employing a diversity of artists, creatives, and arts administrators. It shouldn’t surprise us that different social groups are not fairing the same in terms of creative careers.
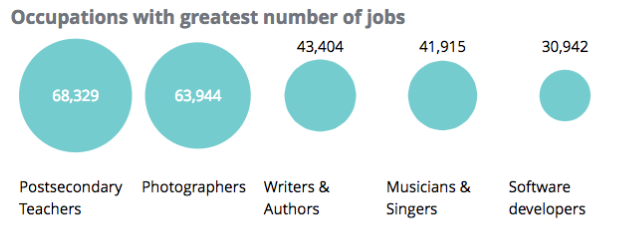
For example, in my city, Latinx artists and crafts people are faring better in the building trades, architecture, fashion, and the performing arts than they are in publishing, writing, or the visual arts. Black people are faring better in the performing arts, including music composition and direction, choreography, acting, and advertising. Whites are exponentially better represented among producers and directors, writers, photographers, and postsecondary teachers. CVSuite also lets us see employment data by age — another key component to inform my work in career development.
What can I do with the diversity data I found in the CVSuite tool? Well, I must start by being aware — or what folks call woke. I need to be a woke professor to shape a relevant academic program, help my students face the real world when they graduate, and actually serve the public good. I use data to inform and target my program’s coursework, special intensives, and community partnerships. Tangible examples of this have included expanding our course offerings in the performing arts, facilitating community-engaged arts-research projects within communities of color, and welcoming more outstanding faculty of color onto our team.
Skills and Places
As the economy shifts, there has been an uptick of discourse about the pillars of non-profit sector work versus cultural entrepreneurship. What professional practices will artists, arts administrators, and arts-policy folk need to know and invest in to remain relevant?
The CVSuite tool provides information on income generation so we can track the balance of contributed and earned income in the creative industries. I embrace and advocate for a hybridity of business models in our program as long as they express our core values of creativity, relevancy, and mission-driven work in the arts. As a result, our students study management strategies for both non-profits and social enterprises. The CVSuite data on revenue generation confirms for me that we are on the right track.
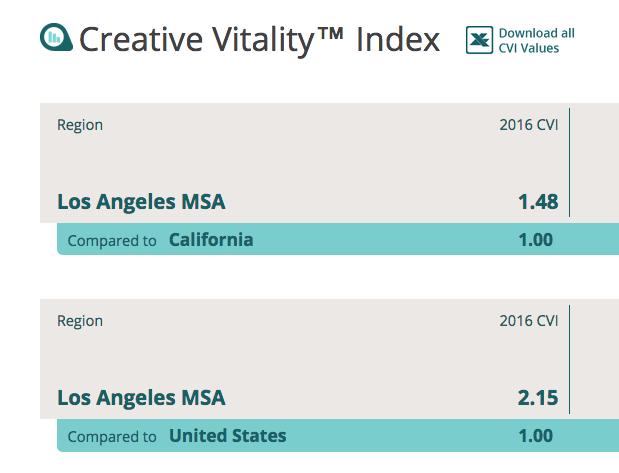
I live and work in Los Angeles and often say that the city is our school. The CVSuite tool provides information that confirms my own perceptions about Los Angeles. As an LA native, the Creative Vitality Index (CVI) in the tool also helps me compare my local region to others nationwide. Not surprisingly, Los Angeles indexes higher than the state of California and the nation as a whole, according to the CVI.
While Los Angeles is a global city and people often refer to us as a cultural capital, the CVSuite’s nuanced data helps people see what kind of a cultural capital we are becoming. What will this mean for different people, communities, and industries on the ground? Will this cultural capital be one of vibrant inclusion, where the flame of creativity and inclusion ignites all of our diverse communities and artistic genres, or will it echo the larger economic inequalities that are plaguing our nation as a whole?
At its root, higher education is committed to teaching, research, and service. I am charged with facilitating a transformative higher education in arts management for the next generation. Having access to the CVSuite tool’s high-quality, disaggregated data at my fingertips will help me do my part to achieve this aim.
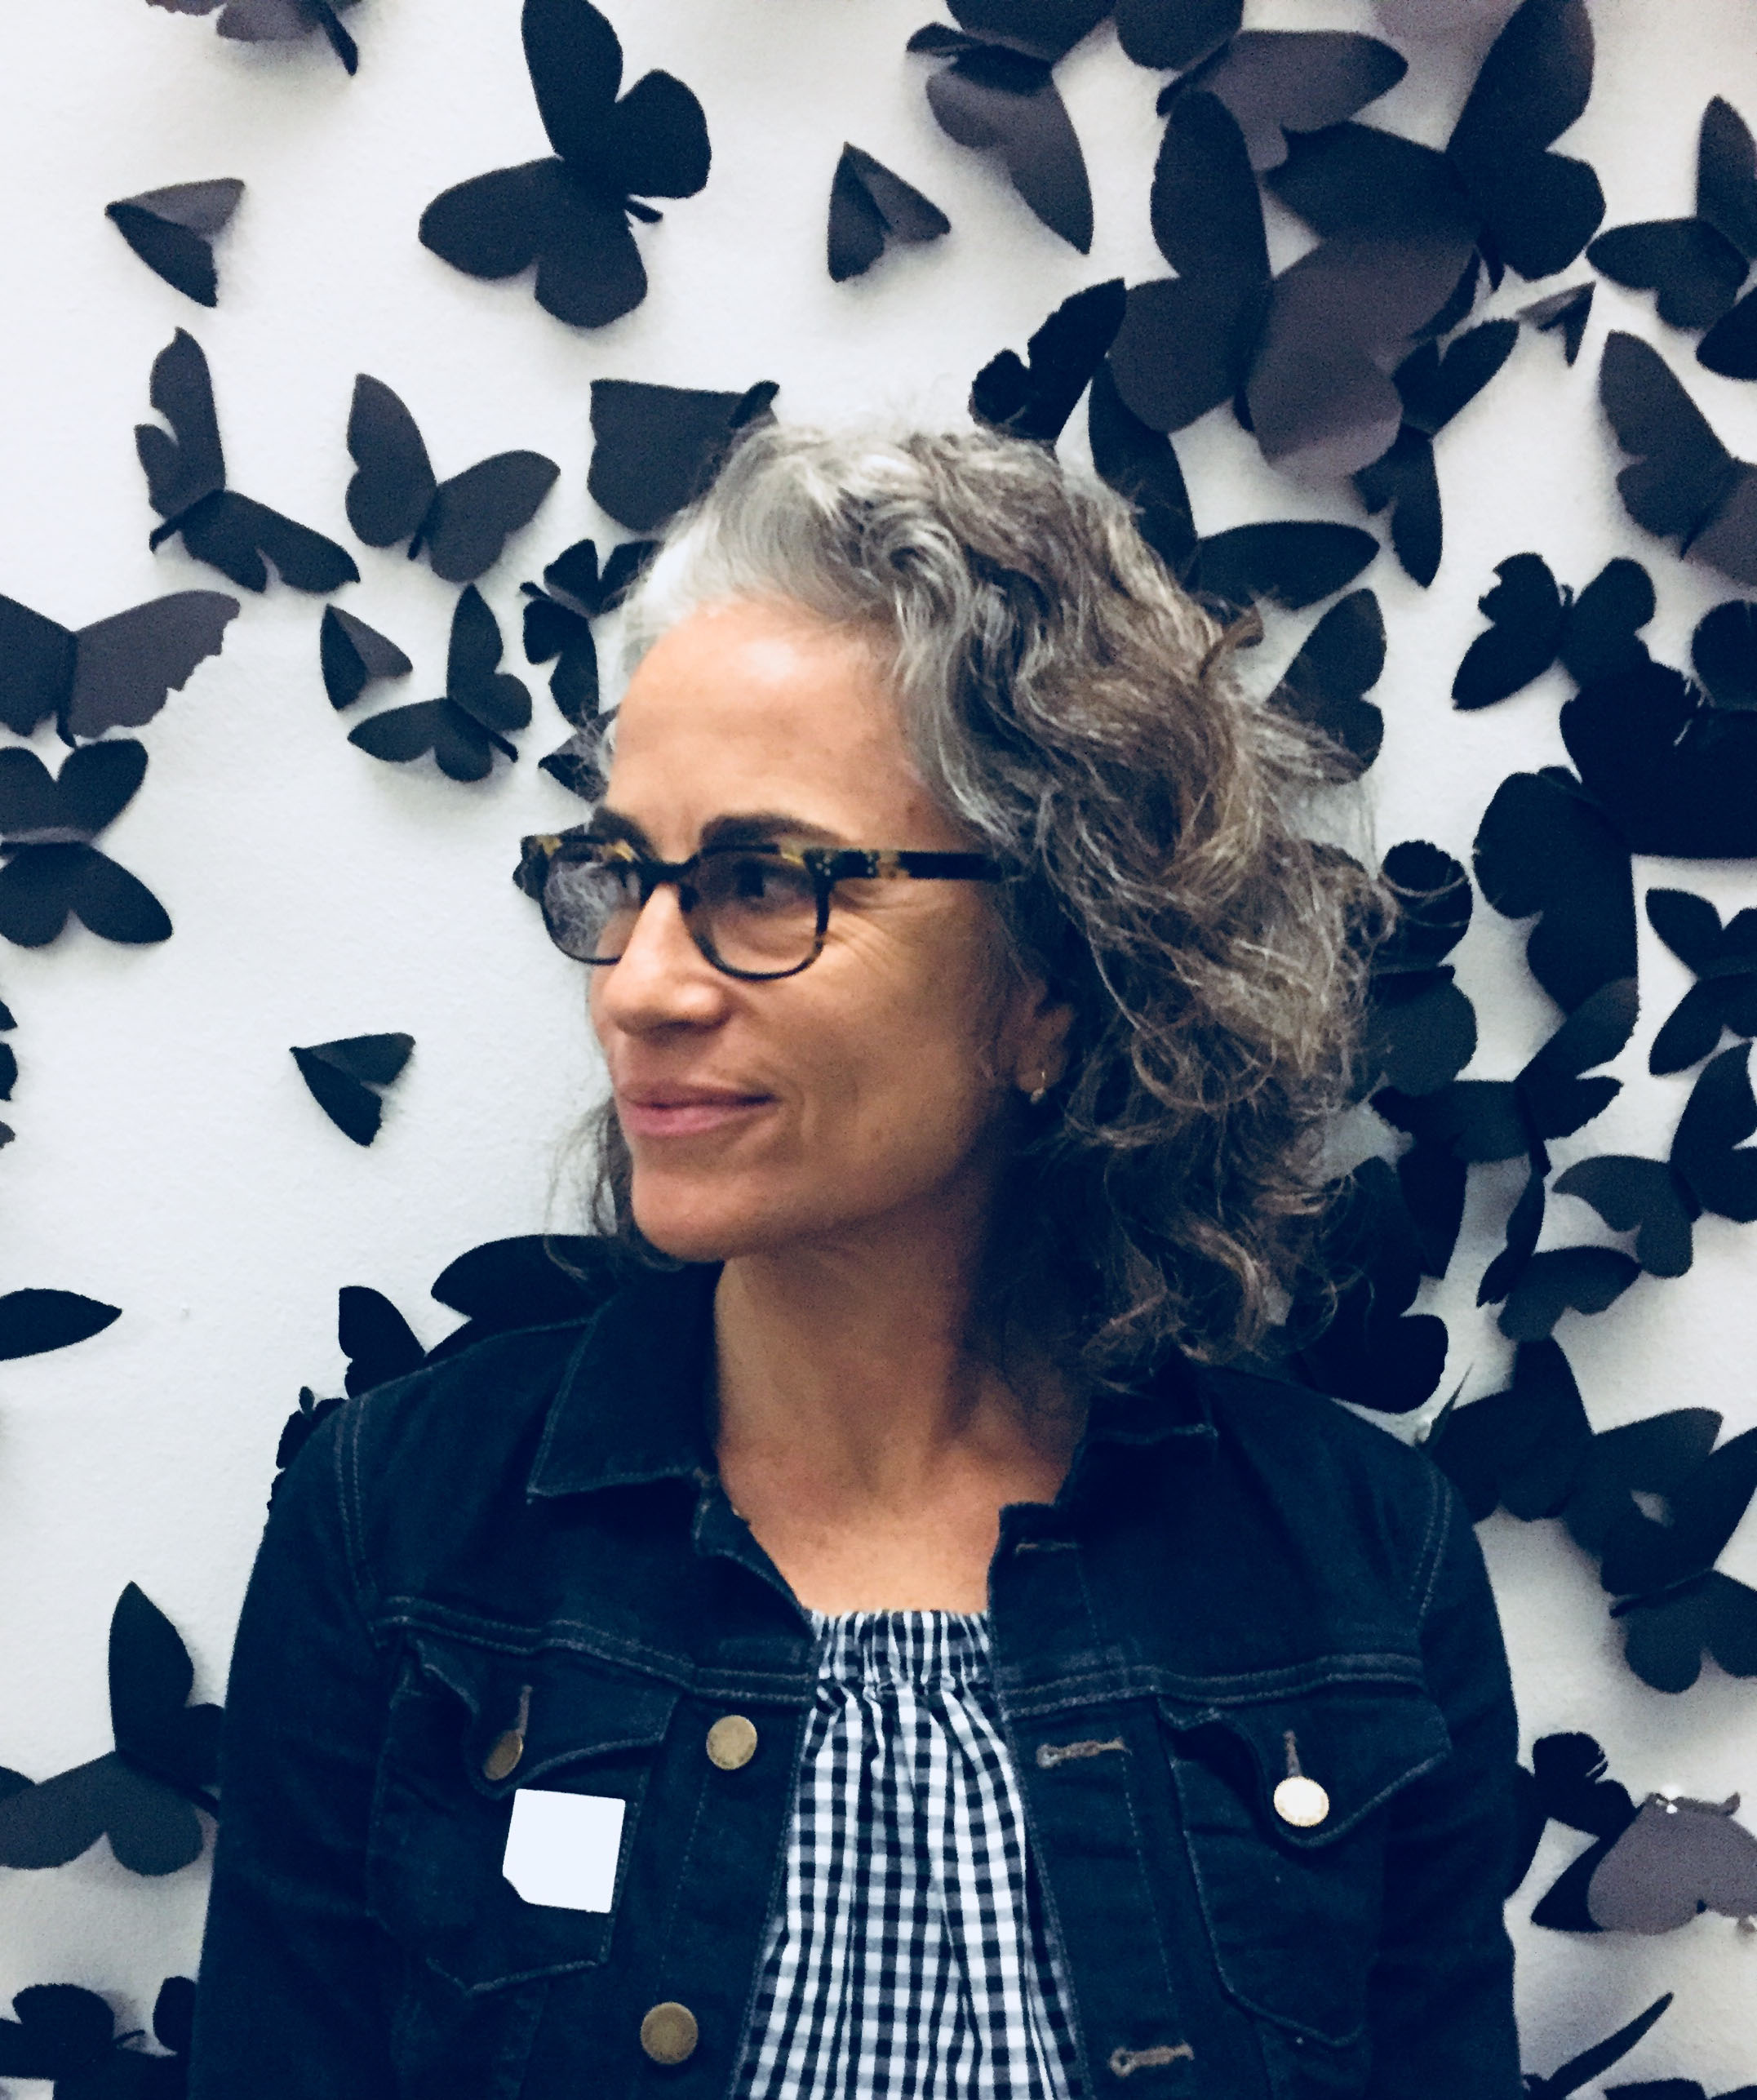 Dr. Amy Shimshon-Santo is a writer, educator, and catalyst who believes the arts and culture are powerful tools for personal and social transformation. Her interdisciplinary work bridges the arts, education, and urban planning. She is the Head of Arts Management for Sotheby’s Institute of Art-LA at the Claremont Graduate University.
Twitter: @amyshimshon
Instagram: shimshona
Web: www.amyshimshon.com

Comments are closed.