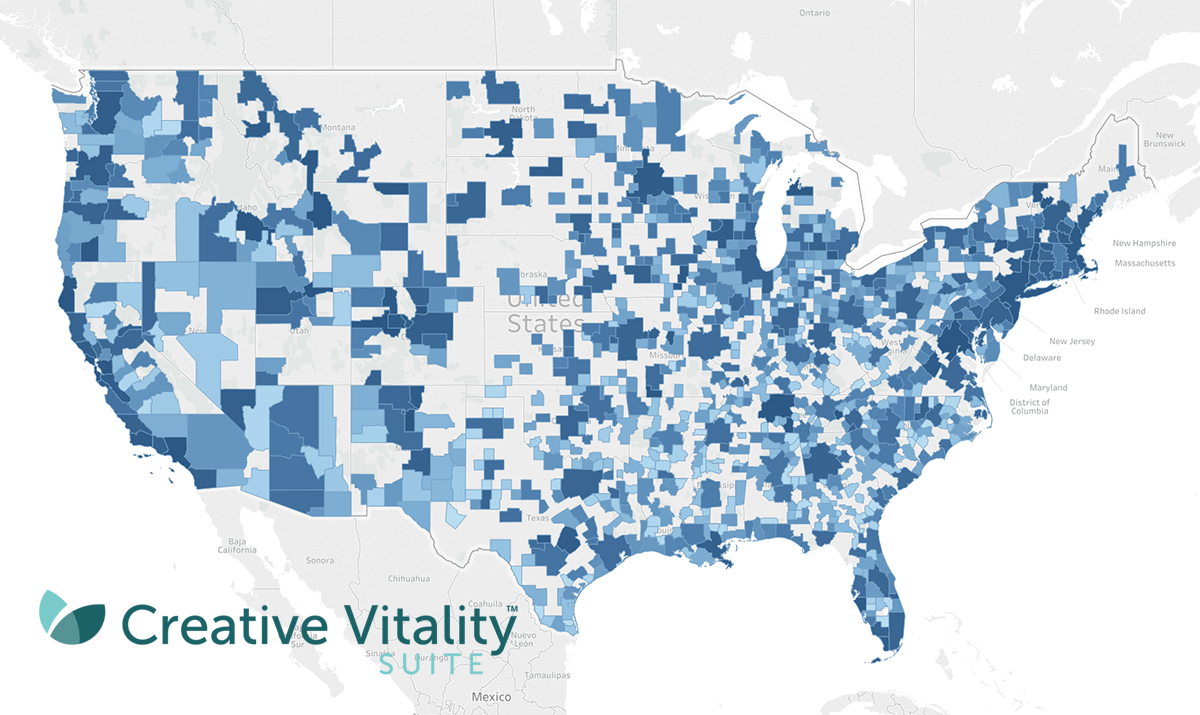
You may already know that the CVSuite offers the creative economy data you need to measure the economic impact of the arts in your region—but did you know that you can also use the Creative Vitality Index (CVI) to compare the creative vitality of your region to other regions in the country?
What is the CVI? Let’s start by defining what an index is.
An index is generally an efficient means of summarizing quantities of interrelated information and describing complex relationships. An index can be, as in the case of the CVI, a single indicator of multiple variables and interactions between those variables.
The Creative Vitality Index measures annual changes in the economic health of an area by integrating economic data streams from both the for-profit and nonprofit sectors. Using per capita measurements of revenue data as well as jobs data from a selection of highly creative occupations, the research aggregates the data streams into a single index value that reflects the relative economic health of a geography’s creative economy. An index value greater than “1” indicates that a region has a higher level of creative economic activity than the national average.
What Calculates the CVI Value?
The CVI value is made up of 40% creative occupations, 40% industry sales, and 20% nonprofit revenues.
The 40% of occupations that contribute to the CVI value were carefully selected from the Bureau of Labor Statistics’ list of Standard Occupational Classification Codes, which correlate measured skill sets around creativity, originality, and fine arts knowledge. These codes are measured by the Employment and Training Administration’s “O*NET” Occupational Network Database. The 40% of industry sales and 20% of nonprofit revenues provide metrics that define the monetary value of the creative economy of a region. These industry codes were carefully selected from the North American Industry Classification System’s (NAICS) 6-digit codes that deal with arts and arts distribution. The nonprofit revenues are determined by the National Taxonomy of Exempt Entities (NTEE) codes set by the Internal Revenue Service (IRS) and the National Center for Charitable Statistics (NCCS). The nonprofit revenues are generated from fundraising, arts, and arts nonprofit organizations.
Where Can I Find My Region’s CVI Value?
The CVI Value page of the CVSuite website is set by default to display the selected region in comparison to the US. This default value can be found on the dashboard (see image below) or by clicking on the CVI Value link in the navigation. Clicking this link will take you to the CVI page where you can see the CVI value and create new CVI comparisons.
The index breakdown consists of a comparison between your region and the comparison region you selected. In the picture below, we can see the CVI breakdown between Colorado and the United States. The breakdown consists of creative occupations, cultural nonprofit revenues, performing arts participation, bookstore and electronic media store sales, music instrument sales, art gallery sales, and the region’s population size. You can also track the percentage change and trends from the prior year to better measure your region’s economic stability.
How can you use the Creative Vitality Index?
Use the CVSuite Index to:
- Compare your region to a peer region and/or the United States.
- Benchmark special projects in the creative economy to track progress year-over-year.
- Identify strengths and weaknesses in an area’s creative economy for further analysis.
- Encourage growth in a particular segment of the creative sector of a local economy.
- Inform public policy decision making and advocacy messaging for the future. development
- And more!
If you are a current CVSuite user or new to CVSuite and are interested in utilizing the CVI to measure your region’s creative economy, contact the CVSuite team.
Stay Up To Date!
Was this content helpful? Follow us on social media to get up to speed on the latest data, trends, and what’s happening in the creative economy.


Comments are closed.