
CVSuite™ Data Dives are designed to help those using the CVSuite online data tool explore and put to work the wide array of data in the tool. This month’s Data Dive centers on the identification of data trends and includes suggestions regarding how to use trend data.
While we cannot know the future with certainty, an examination of data in search of trends can help inform of where we are headed. A trend is a prevailing tendency or inclination. Knowing the trends in a creative economy not only can help predict the future but also can assist in the evaluation of past actions that were designed to cause certain kinds of change.
Question: How can I use the CVSuite to identify trends in my region?
Because a trend relies on more than one data point, the multi-year data streams in the CVSuite provide a rich trove of linear data that can be examined for trends. Examining year-over-year changes in data is one of the simplest and most common ways of identifying trends for analysis. The Creative Vitality™ Suite tool allows you to identify and examine trends that occur over a three-year period without leaving the tool. Longer term trends can be investigated by downloading Excel reports to analyze trends.
Understanding Trends
Identifying and examining trends can be a productive way to gain a deeper understanding of changes in the creative economy from year to year. Among other things, a trend can tell you whether specific occupations, industries, or nonprofit revenues are growing or declining.
The range of years is an important factor when identifying a trend. A one-year timeframe is a good way to obtain a snapshot of what is currently occurring. Unless the year can be divided into multiple sequential data points, however, it cannot provide trend data. The analysis of multiple years of data to identify trends is desirable because multi-year views tend to remove some of the volatility in the data set. Shorter ranges tend to be more volatile and can contain big swings that longer term multi-year views tend to mitigate. Try to work with three- and five-year trends to obtain a more accurate perspective on how a region’s creative economy is progressing.
Trend Analysis
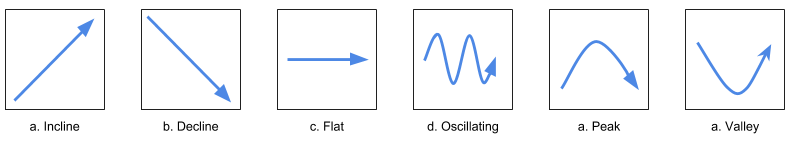
There are six distinct patterns in trend analysis. An incline (a) indicates that there is positive growth in an area, while a decline (b) illustrates a decline in some aspect of creative economy activity. Sometimes, a trend will not indicate any kind of change, and the trend will have a horizontal pattern (c). An oscillating trend (d) is found where there are repeated ups and downs on the trend line. Such oscillation reflects volatility or seasonality within the data. Overarching peaks and valleys in long-term trends can indicate an economy recovering from decline or an economy that has stagnated and is starting to weaken. While investigating trends in your area, keep a look out for these patterns.
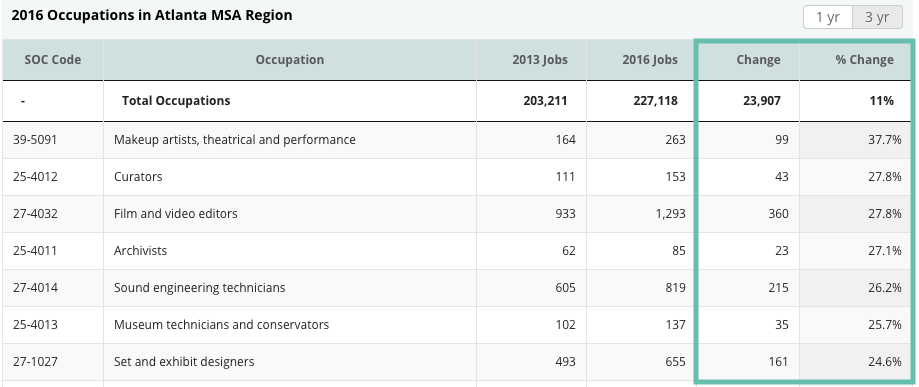
Occupation Percentage Change
The sortable table on the Occupations dashboard provides an overview of a region’s creative jobs. It includes a list of occupations, the number of new creative jobs in place by year, the total change in numbers of jobs from previous years, and the percentage change in jobs.
The CVSuite allows users to readily examine annual changes in a region’s creative jobs over a three-year period. The tool allows users to sort by percentage of change. In order to sort by descending values, sort the column twice. This functionality reveals which creative jobs have had the largest percentage increase in the past year or three years.
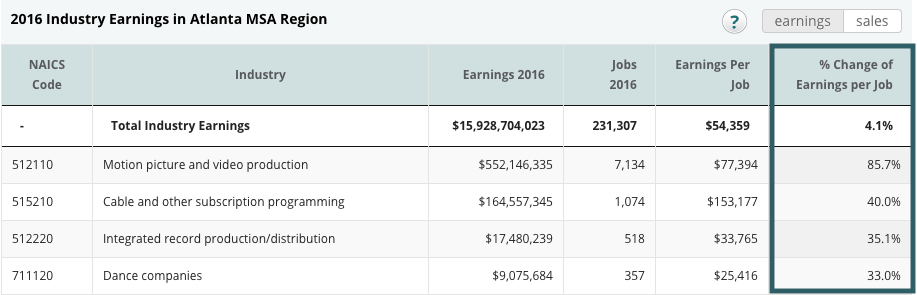
Changes in Industry Earnings
The sortable table on the Industry dashboard provides an overview of the industries in the region. In addition, you can choose to explore the earnings or sales for the creative industries within your region. If you select earnings, you can compare the percent change of earnings per job to the previous year.
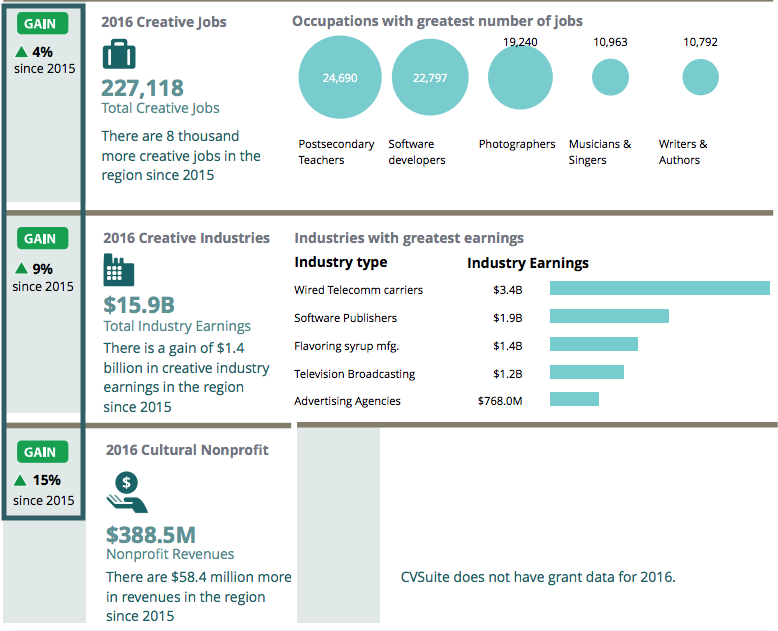
Snapshot Report
The Snapshot Report allows CVSuite users to pull key data points into a single, easy-to-read report. The report presents percent changes in creative jobs, creative industries, and nonprofit revenues. The CVSuite Snapshot Report also compares the current year to the immediate past year.
Conclusion
The Creative Vitality Suite gives you the flexibility to pull the data from any data year and identify trends.

Examine one-year trends to measure recent changes in your creative economy. Explore long-term trends to see how your region’s creative economy is evolving.
If you want a longer trending analysis, you can collect five years of data from the Excel reports and compile them for a comprehensive analysis. This method is helpful for developing trending charts and comparing occupations, industries, and other regions.
The CVSuite provides you with at-a-glance percentages to help users identify trends. There are a variety of places within the tool to see these trends and gain a better understanding of a region’s creative economy.
Each month, the CVSuite team will highlight deeper dives within the CVSuite data and tool. Our goal is to help you best analyze the areas you are studying and to tell compelling and comprehensive data-driven stories.
We want to hear from you! If you have a specific question, please email us at cvsuite@westaf.org or call Susan Gillespie at 303.629.1166.
Comments are closed.