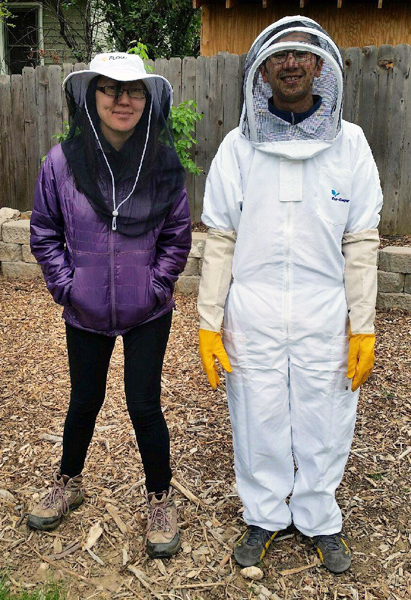
Paul Nguyen is the WESTAF’s Data Specialist. His primary responsibility is to manage the flow of data from outside sources into the CVSuite data tool. As you can see below, his work is much more than a “plug-and-play” type of activity. In this blog, Paul answers a few questions about his work. His answers should provide some insights to users of CVSuite data.
You are an artist and a graduate of the Parsons School of Design in New York City. What did you learn from that experience that you apply to your daily work with data?
I’ve always been a nerd for math and the sciences. In high school, I thought I was going to become a surgeon, but after I created my first painting, I was hooked. There is an amazing magic that happens during an artist’s process that allows one to explore, re-work, imagine, and even deconstruct ideas. Data offer a similar artistic space. When I am presented with a new data set, I might approach it with a question in mind that I need an answer for. Other times, I need to look at data and identify patterns that can inform me of the nature of some kind of activity. Exploring data gives me the opportunity to approach data without any reservations. This is similar to when, as an artist, you put that first stroke on a canvas. My background in the arts may not seem to apply to my work with data, but there is actually a strong relationship. I believe my involvement in art has made me a better data manager.
You manage the transmission of large sets of data into the CVSuite™ data tool. Give us an idea of the key challenges you face in doing so.
One big challenge I face almost every day is standardizing and further cleaning the data used in the Creative Vitality Suite™. The CVSuite uses four distinct core data streams, and these data streams are made available to WESTAF at various times throughout the year. So I need to work to input the data in a way that recognizes and, if possible, adjusts for this intra-year variability. Also, data in these streams are cleaned in different ways at their source before we receive them. I need to review how the data are cleaned and make adjustments across data sets to ensure that, to the degree possible, data represent the same degree of refinement across the data sets. This is a lot of work, but the end product is the ability of the users who access data in the CVSuite to use high-quality and consistent data with every dollar value, calculation, and formatting checked and tripled checked by our quality-assurance process. We spend a great deal of time preparing the data so it is usable by our clients.
Every data stream has its own challenges, and there are various ways to manage these different streams. For example, our industry sales data exist in multiple spreadsheets for the entire United States at both the county and Zip Code levels. Thus, there are many spreadsheets of data for me to manage. Then there is grant data, which is available quarterly and contains updates of new grants as well as changes to grants to adjust from previous quarters. In this process, we determine which data are new and which require adjustment. The nonprofit data present other challenges. They include every question asked on the IRS I990 form. We trim this large data set down to the relevant fields offered in the site. The Creative Vitality Suite staff deals with many of the same challenges any user of data will encounter. We have the data, but we need to clean and adjust it with great care to make it understandable and useable.
From time to time, you receive calls from CVSuite™ clients who seek help in understanding the data they have purchased. What are some key misunderstandings about the data that prompt such questions?
A frequent inquiry we receive is why the Creative Vitality Suite team chose the codes we have in the tool. This is a good question because there is no universally accepted single definition of what comprises the creative economy. There are, however, several proposed code-based definitions. The most widely accepted one to date is the one by the Creative Economy Coalition, which compiled a recommended definition based on a review of 29 creative economy reports. We provide a wide variety of industry and occupation codes and allow the users to turn them on or off and thus define their creative economy based on activity local to their region. The definition of creative activity in Denver might not be the same as what is considered to be the creative economy in New Orleans. We currently have 131 codes in the system. Shortly, we will be adding another 51.
Sometimes creative economy data for an area tell a story that does not seem to reflect the actual situation. When this happens, what do you advise clients to do?
All researchers encounter situations in which there is either not enough data to support a particular analysis or the data tell a completely different story from what the researcher was expecting to find. I always think of these situations as opportunities to question what the data appear to be telling me. One consideration that needs to be made is whether or not a study area is simply too small to produce meaningful data within a national data set. At times, extremely small clusters of Zip Codes, or Zip Codes with very low populations simply do not contain enough data to tell a story. Another situation that can arise is one in which the underlying dynamics of a study area need to be known in order to properly interpret the data. For example, a small town might sponsor successful art festivals twice a year. While those events may appear to have a major economic impact on the community, if the artists selling art or performing at the festivals are from out of town, a large number of the dollars earned and the count of the jobs related to the festivals do not benefit the region because those dollars and the related jobs are not staying in the region. As a result, this economic activity will not appear in the local data set as a highly significant activity.
Looking to the future, what would you like to add to the CVSuite tool to make it even more useful to the field?
The Creative Vitality Suite is a great tool to easily access creative economy data. From my experience, I would observe that not all users are comfortable with data. They don’t know what to look for or which questions to ask. I would like the CVSuite tool to have more interactive features and also visualizations that present the stories to users so that they don’t have to dig too deep. New reports catered toward specific audiences would also be valuable.
On a personal note, I understand that you and your wife have recently started to keep bees. What’s the story?
I have a newfound love for bees. A friend of ours wanted to start beekeeping and, after investing in the equipment, she learned she would not be able to keep bees on her property because of city restrictions. We were a little scared at the thought of keeping thousands of bees in our backyard because who wants to get stung by a bee? It has only been a couple weeks now, but our fears are subsiding. I love watching them come and go from the hive with little bits of pollen on their legs. If you have the space, I recommend taking a look at beekeeping. They are fascinating insects and surprisingly relaxing to watch. Did you know that the majority of honey bees are female? The colony only keeps a small number of males alive to mate with the queen.

Jun
01


Comments are closed.