Most in the arts field understand the ever-increasing importance of data for effective advancement of the arts. Newspapers and data-driven blogs such as Nate Silver’s FiveThirtyEight routinely reinforce that the age of “big data” is upon us, even in the arts. Reports of clairvoyant data predicting elections, crowd-sourced data lowering crime rates, and digital consumer data increasing profit margins are abundant. There is no end to what data can do these days–or so the story goes.
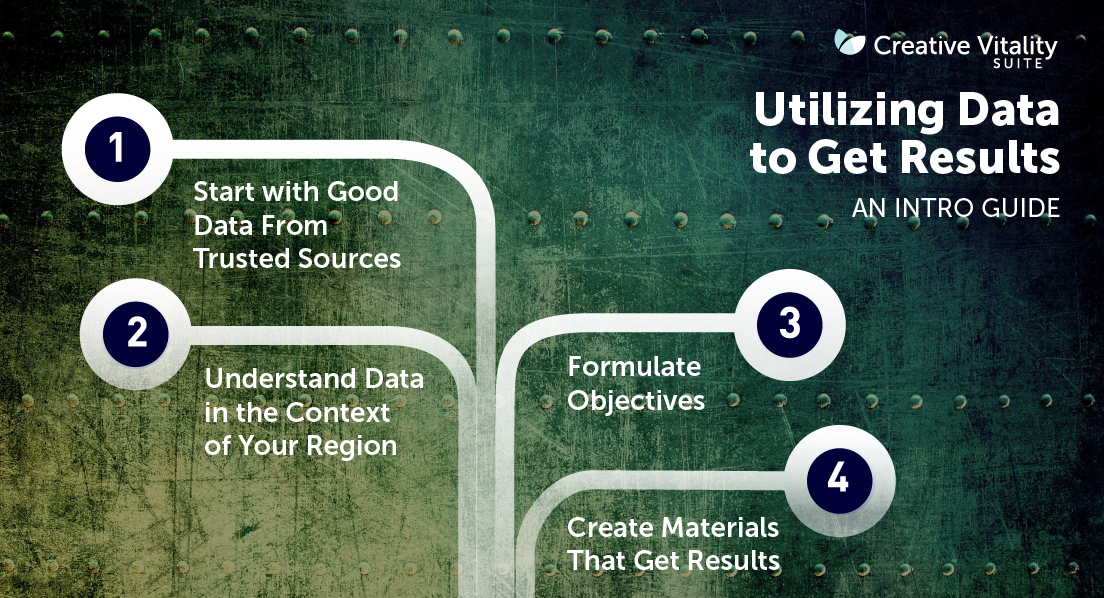
 Start with Good Data From Trusted Sources
Data quality is determined by several factors: Where it comes from, who analyzes it and the processes it undergoes in order to make it usable. Before going through these steps, data are considered raw–and raw data do nothing on their own–they are lazy.¹ Considerable effort by highly trained researchers goes into gathering and analyzing the remarkable data we hear so much about in the news. Data have to be interpreted and analyzed based on context: Is a percentage increase indicated by data a good thing, bad thing, or something else? For practitioners in all fields, data must also be used to reach some desirable end. The real story of the usefulness of data is that they are only as valuable as we make them, without the careful hand of knowledgeable practitioners, they are meaningless.
 Understand Data in the Context of Your Region
The CVSuite™ takes care of the first steps of data management, but interpretation, analysis, and application require specialized and localized knowledge, which only the client has. The CVSuite™ team works with clients to put data to work from a client-centered perspective by starting with the data interpretation process. The team guides clients to ask a few initial questions of the data. These lines of lines of inquiry help to warm up lazy data:
- Do data in CVSuite™ make sense based on your own understanding of your creative economy?
- What is or has happened in your community that might explain trends presented in the data?
- What is surprising about the data?
 Formulate Objectives
These and other questions can guide the important first step of interpretation. CVSuite™ data certainly will reveal new and interesting findings about your creative economy, but the data will also reinforce with empirical validity what is intuitively or anecdotally known about a region’s creative economy. Asking these and other questions of the data will ensure that CVSuite™ data reports will be fully understood by users. Once data are thoroughly understood, the CVSuite™ team advises users to reflect on their own objectives for data. The team asks questions such as:
- What projects can be advanced or evaluated by data?
- What problems can be solved or questions answered by the data?
- What are the ways that data can be specifically helpful to your work?
- Are you using data for marketing or advocacy? Benchmarking or program evaluation? Cultural planning and assessment?
Here are a few sample projects that come from the above questions:
- A capital campaign for a performing arts complex could be legitimized by data showing the vibrancy of dance and theater in a region.
- Longitudinal data on changes in design occupations could be used to benchmark a STEM-to-STEAM educational initiative.
- A close look at nonprofit revenues in the arts and culture sectors could inform programs to diversify development strategies.
 Get Results Through Creating Materials That Effectively Communicate
The old saying that there are “lies, damned lies, and statistics,” speaks to how data can be manipulated to tell a specific story. Data can be used to lead or mislead, but what they do depends on the user and the user’s intentions. CVSuite™ data are no different. The strength of the data depends not only on the numbers, but on what you do with them.
An effective approach to communicating the data are through creating reports and marketing collateral. Careful consideration of who the audience is will better assure that your message is received. To see examples of how clients have put CVSuite™ data to work visit cvsuite.org, scroll to the section near the bottom of the page titled “Who Use’s CVSuite™.” Here is a short list of the types of collateral users have created:
- Reports
- Marketing collateral (brochures, one pager)
- Presentations (powerpoint, prezi)
- Online materials (website, Blog posts)
¹ Another overlooked truth is that the word “data” is plural for “datum.”
Infographic vectors by Freepik


Comments are closed.